Estimated Value: $384,207 - $460,000
3
Beds
2
Baths
2,923
Sq Ft
$149/Sq Ft
Est. Value
About This Home
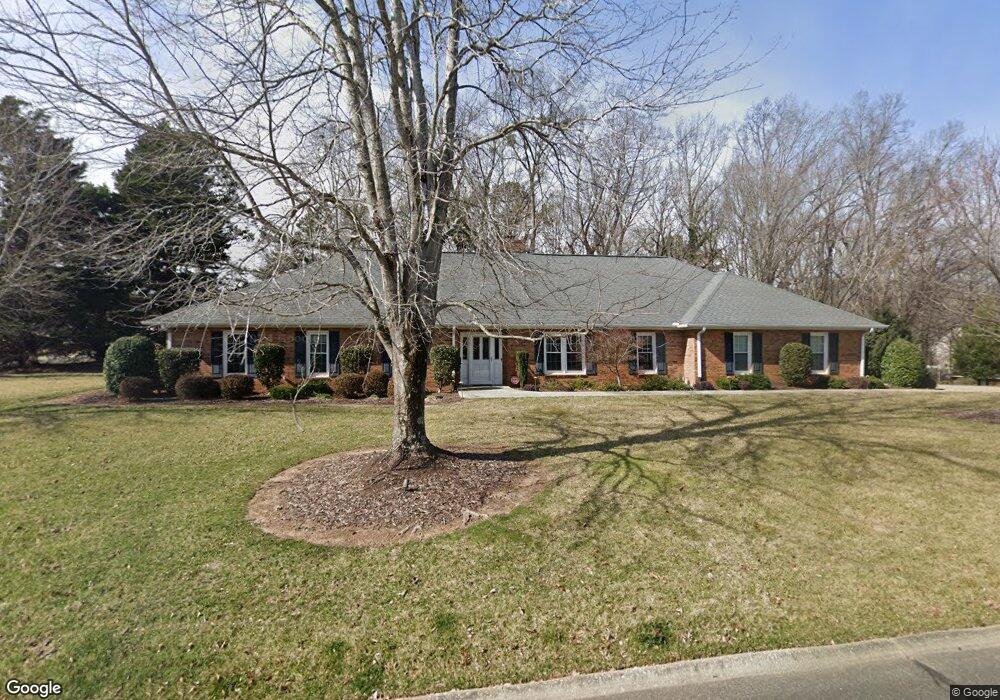
This home is located at 101 S Pointe Ct, Moore, SC 29369 and is currently estimated at $435,802, approximately $149 per square foot. 101 S Pointe Ct is a home located in Spartanburg County with nearby schools including River Ridge Elementary School, Florence Chapel Middle School, and Byrnes Freshman Academy.
Ownership History
Date
Name
Owned For
Owner Type
Purchase Details
Closed on
Jun 10, 2011
Sold by
Bigby Jefferson G and Bigby Katherine R
Bought by
Bigby Jefferson G and Bigby Katherine R
Current Estimated Value
Purchase Details
Closed on
Oct 1, 2009
Sold by
Blanton Jacqueline Denise and Harris Jacqueline B
Bought by
Bigby Jefferson G and Bigby Katherine R
Home Financials for this Owner
Home Financials are based on the most recent Mortgage that was taken out on this home.
Original Mortgage
$167,920
Outstanding Balance
$109,035
Interest Rate
5.05%
Mortgage Type
Future Advance Clause Open End Mortgage
Estimated Equity
$326,767
Create a Home Valuation Report for This Property
The Home Valuation Report is an in-depth analysis detailing your home's value as well as a comparison with similar homes in the area
Home Values in the Area
Average Home Value in this Area
Purchase History
We collect this data history from publicly available records. To have your information removed, we recommend requesting removal directly through your county’s website.
| Date | Buyer | Sale Price | Title Company |
|---|---|---|---|
| Bigby Jefferson G | -- | -- | |
| Bigby Jefferson G | $209,900 | -- |
Source: Public Records
Mortgage History
We collect this data history from publicly available records. To have your information removed, we recommend requesting removal directly through your county’s website.
| Date | Status | Borrower | Loan Amount |
|---|---|---|---|
| Open | Bigby Jefferson G | $167,920 |
Source: Public Records
Tax History
| Year | Tax Paid | Tax Assessment Tax Assessment Total Assessment is a certain percentage of the fair market value that is determined by local assessors to be the total taxable value of land and additions on the property. | Land | Improvement |
|---|---|---|---|---|
| 2025 | $2,079 | $12,269 | $1,837 | $10,432 |
| 2023 | $2,079 | $12,269 | $1,837 | $10,432 |
| 2022 | $1,901 | $10,668 | $1,400 | $9,268 |
| 2021 | $2,086 | $10,668 | $1,400 | $9,268 |
| 2020 | $2,054 | $11,740 | $1,396 | $10,344 |
| 2019 | $2,049 | $11,740 | $1,396 | $10,344 |
| 2018 | $1,947 | $11,740 | $1,396 | $10,344 |
| 2017 | $1,677 | $9,997 | $1,371 | $8,626 |
| 2016 | $1,625 | $9,997 | $1,371 | $8,626 |
| 2015 | $1,559 | $8,924 | $1,400 | $7,524 |
| 2014 | $1,401 | $8,924 | $1,400 | $7,524 |
Source: Public Records
Map
Nearby Homes
- 107 S Pointe Ct
- 140 Lauden Dr
- 0 Farmington Ct
- 739 Kingswood Valley Dr
- 243 Lauren Hope Ln
- 212 Farmington Ct
- 248 Lauren Hope Ln
- 127 Twin Lakes Dr
- 146 Morning Lake Dr
- 106 Riverbank Ct
- 102 S Hamlet Ct
- 206 Rexford Dr
- 101 Plantation Dr
- 616 Jules Ln
- 612 Jules Ln
- 610 Jules Ln
- 614 Jules Ln
- 423 Rexford Dr
- 102 Memory Ln
- 860 Pleasant Falls Dr
Your Personal Tour Guide
Ask me questions while you tour the home.