101 Stone Ridge Meadows Dr O Fallon, MO 63366
Estimated Value: $656,503 - $857,000
3
Beds
3
Baths
2,582
Sq Ft
$289/Sq Ft
Est. Value
About This Home
This home is located at 101 Stone Ridge Meadows Dr, O Fallon, MO 63366 and is currently estimated at $745,834, approximately $288 per square foot. 101 Stone Ridge Meadows Dr is a home located in St. Charles County with nearby schools including Mount Hope Elementary School, Fort Zumwalt North Middle School, and Fort Zumwalt North High School.
Ownership History
Date
Name
Owned For
Owner Type
Purchase Details
Closed on
Mar 19, 2025
Sold by
Heyen Nicole R and Heyen Dennis
Bought by
Dennis And Nicole Heyen Family Trust and Heyen
Current Estimated Value
Purchase Details
Closed on
Mar 6, 2024
Sold by
Nicole Moreau Revocable Living Trust
Bought by
Dennis And Nicole Heyen Family Trust and Heyen
Purchase Details
Closed on
Oct 30, 2020
Sold by
Moreau Nicole R and Heyen Nicole R
Bought by
Heyen Nicole R and Heyen Dennis
Home Financials for this Owner
Home Financials are based on the most recent Mortgage that was taken out on this home.
Original Mortgage
$385,750
Interest Rate
2.9%
Mortgage Type
New Conventional
Purchase Details
Closed on
Mar 4, 2016
Sold by
Moreau Nicole R and The Nicole Moreau Revocable Li
Bought by
Moreau Nicole R
Purchase Details
Closed on
Dec 29, 2014
Sold by
Moreau Nicole R and The Nicole Moreau Revocable Li
Bought by
Moreau Nicole R
Home Financials for this Owner
Home Financials are based on the most recent Mortgage that was taken out on this home.
Original Mortgage
$399,000
Interest Rate
3.87%
Mortgage Type
Adjustable Rate Mortgage/ARM
Purchase Details
Closed on
Sep 27, 2013
Sold by
Moreau Nicole R and Dierking Nicole R
Bought by
Moreau Nicole R and The Nicole Moreau Revocable Li
Home Financials for this Owner
Home Financials are based on the most recent Mortgage that was taken out on this home.
Original Mortgage
$126,000
Interest Rate
4.62%
Mortgage Type
New Conventional
Purchase Details
Closed on
Jul 10, 2012
Sold by
Dierking Daniel D and Dierking Nicole R
Bought by
Dierking Nicole R
Purchase Details
Closed on
Oct 8, 2010
Sold by
Dierking Daniel D and Dierking Nicole R
Bought by
Dierking Daniel D and Dierking Nicole R
Home Financials for this Owner
Home Financials are based on the most recent Mortgage that was taken out on this home.
Original Mortgage
$405,000
Interest Rate
4.4%
Mortgage Type
New Conventional
Purchase Details
Closed on
Nov 20, 2009
Sold by
Dierking Daniel D and Dierking Nicole R
Bought by
Dierking Daniel D and Dierking Nicole R
Purchase Details
Closed on
Jul 27, 2007
Sold by
Encore Development Co Llc
Bought by
Dierking Daniel and Dierking Nicole
Home Financials for this Owner
Home Financials are based on the most recent Mortgage that was taken out on this home.
Original Mortgage
$87,125
Interest Rate
6.73%
Mortgage Type
Purchase Money Mortgage
Create a Home Valuation Report for This Property
The Home Valuation Report is an in-depth analysis detailing your home's value as well as a comparison with similar homes in the area
Home Values in the Area
Average Home Value in this Area
Purchase History
| Date | Buyer | Sale Price | Title Company |
|---|---|---|---|
| Dennis And Nicole Heyen Family Trust | -- | None Listed On Document | |
| Dennis And Nicole Heyen Family Trust | -- | None Listed On Document | |
| Heyen Nicole R | -- | Chesterfield Title Agcy Llc | |
| Heyen Nicole R | $513,047 | Chesterfield Title Agency | |
| Moreau Nicole R | -- | Chesterfield Title Agency Ll | |
| Moreau Nicole R | -- | Town & Country Title | |
| Moreau Nicole R | -- | Town & Country Title | |
| Moreau Nicole R | -- | None Available | |
| Dierking Nicole R | -- | None Available | |
| Dierking Daniel D | -- | Benchmark Title Llc | |
| Dierking Daniel D | -- | None Available | |
| Dierking Daniel | -- | Title Partners Llc I |
Source: Public Records
Mortgage History
| Date | Status | Borrower | Loan Amount |
|---|---|---|---|
| Previous Owner | Heyen Nicole R | $385,750 | |
| Previous Owner | Moreau Nicole R | $399,000 | |
| Previous Owner | Moreau Nicole R | $126,000 | |
| Previous Owner | Dierking Daniel D | $405,000 | |
| Previous Owner | Dierking Daniel | $87,125 |
Source: Public Records
Tax History Compared to Growth
Tax History
| Year | Tax Paid | Tax Assessment Tax Assessment Total Assessment is a certain percentage of the fair market value that is determined by local assessors to be the total taxable value of land and additions on the property. | Land | Improvement |
|---|---|---|---|---|
| 2025 | $6,360 | $113,698 | -- | -- |
| 2023 | $6,357 | $101,427 | $0 | $0 |
| 2022 | $6,131 | $91,025 | $0 | $0 |
| 2021 | $6,127 | $91,025 | $0 | $0 |
| 2020 | $5,704 | $81,863 | $0 | $0 |
| 2019 | $5,685 | $81,863 | $0 | $0 |
| 2018 | $5,422 | $74,613 | $0 | $0 |
| 2017 | $5,396 | $74,613 | $0 | $0 |
| 2016 | $5,061 | $69,676 | $0 | $0 |
| 2015 | $4,702 | $69,676 | $0 | $0 |
| 2014 | -- | $62,702 | $0 | $0 |
Source: Public Records
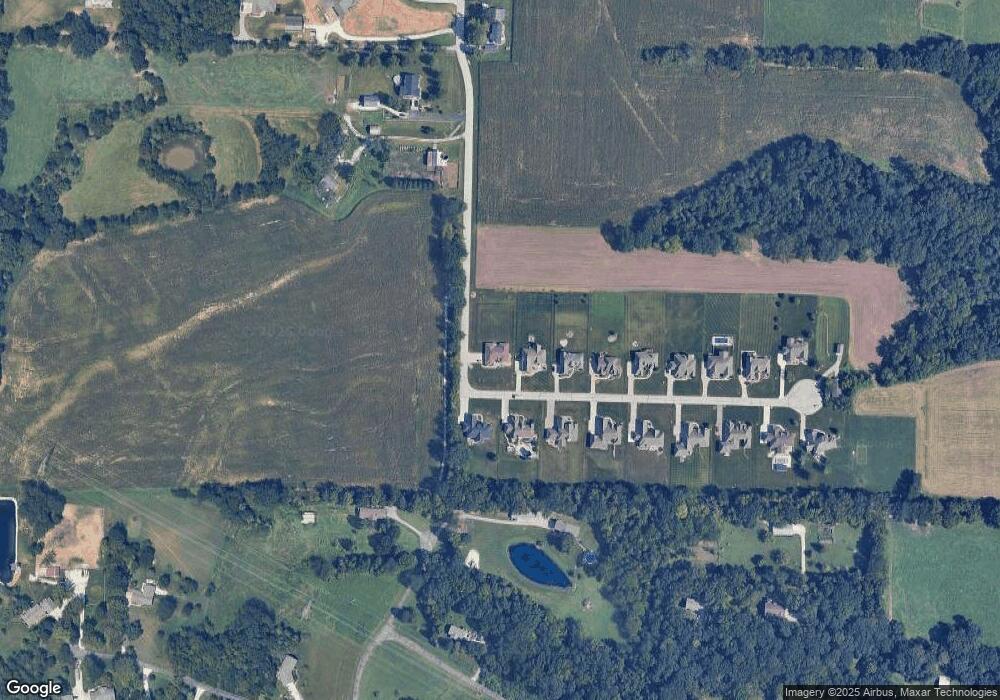
Map
Nearby Homes
- 203 Royal Oaks Dr
- 1342 Woodgrove Park Dr
- 3.59 Acres Matteson Blvd
- 7.19 Acres Matteson Blvd
- 3.6 Acres Matteson Blvd
- 0 Matteson Blvd
- 765 Koch Rd
- 1317 New Charter Ln
- 1040 Highway P
- 2160 Wyndbrook Ln
- 1466 Koch Rd
- 23 New Freedom Way
- 23 Plantation Oaks Ln
- 23 Prairie Crossing Dr
- 120 Drury Ct
- 421 Knights Valley Ct
- 421 Dames Park Dr
- 419 Dames Park Dr
- 12 Warshire Ct Unit 67A
- 409 Dames Park Dr
- 103 Stone Ridge Meadows Dr
- 100 Stone Ridge Meadows Dr
- 105 Stone Ridge Meadows Dr
- 102 Stone Ridge Meadows Dr
- 107 Stone Ridge Meadows Dr
- 0Lot 2 Stone Ridge Meadows Dr
- 0Lot 15 Stone Ridge Meadows Dr
- 0Lot 17 Stone Ridge Meadows Dr
- 0Lot 8 Stone Ridge Meadows Dr
- 0Lot 7 Stone Ridge Meadows Dr
- 0Lot 4 Stone Ridge Meadows Dr
- 0Lot 5 Stone Ridge Meadows Dr
- 0Lot 3 Stone Ridge Meadows Dr
- 0Lot 6 Stone Ridge Meadows Dr
- 104 Stone Ridge Meadows Dr
- 106 Stone Ridge Meadows Dr
- 109 Stone Ridge Meadows Dr
- 0Lot 14 Stone Ridge Meadows Dr
- 0Lot 4TBB Stone Ridge Meadows Dr
- 0Lot 3TBB Stone Ridge Meadows Dr