
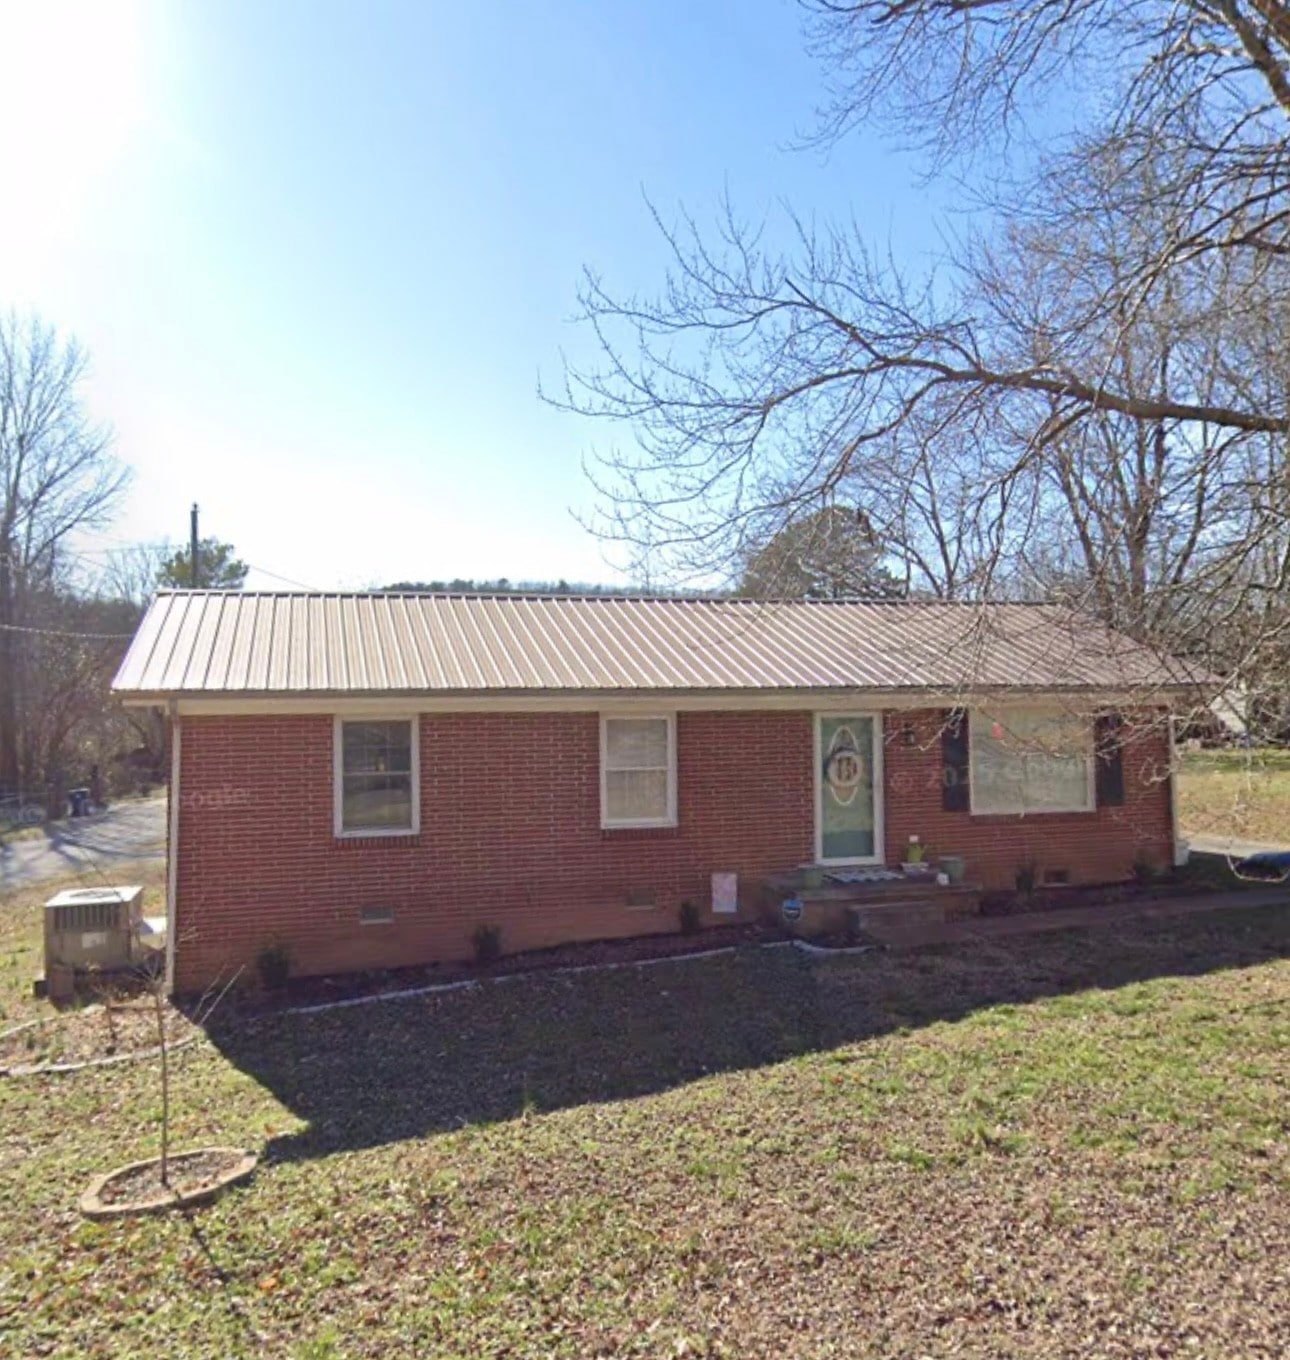
101 Vaughn St Waynesboro, TN 38485
3
Beds
1
Bath
1,125
Sq Ft
9,148
Sq Ft Lot
Highlights
- No HOA
- Central Heating
- Property has 1 Level
- Cooling Available
About This Home
As of June 20253 bed 1 bath brick home in quiet neighborhood within walking distance from schools and shopping
Last Agent to Sell the Property
United Country-Terry Realty License #347336 Listed on: 04/18/2025
Last Buyer's Agent
United Country-Terry Realty License #347336 Listed on: 04/18/2025
Home Details
Home Type
- Single Family
Est. Annual Taxes
- $605
Year Built
- Built in 1972
Lot Details
- 9,148 Sq Ft Lot
- Lot Dimensions are 80x120
Home Design
- Brick Exterior Construction
Interior Spaces
- 1,125 Sq Ft Home
- Property has 1 Level
- Laminate Flooring
- Crawl Space
- Dishwasher
Bedrooms and Bathrooms
- 3 Main Level Bedrooms
- 1 Full Bathroom
Schools
- Waynesboro Elementary School
- Waynesboro Middle School
- Wayne County High School
Utilities
- Cooling Available
- Central Heating
Community Details
- No Home Owners Association
- Dogwood Heights Subdivision
Listing and Financial Details
- Assessor Parcel Number 077K B 01300 000
Ownership History
Date
Name
Owned For
Owner Type
Purchase Details
Closed on
Jun 15, 2018
Sold by
Jackson Jamie
Bought by
Bumphus William Trey
Home Financials for this Owner
Home Financials are based on the most recent Mortgage that was taken out on this home.
Original Mortgage
$58,676
Interest Rate
4.6%
Mortgage Type
New Conventional
Purchase Details
Closed on
Mar 28, 2016
Sold by
Kelly Dan
Bought by
Jackson Jamie
Purchase Details
Closed on
Sep 2, 1994
Bought by
Kelly Dan J
Purchase Details
Closed on
Apr 8, 1993
Bought by
Dicus James D
Purchase Details
Closed on
Jan 8, 1992
Bought by
Baker Waymon I
Purchase Details
Closed on
Jun 28, 1978
Bought by
Baker Waymon I
Purchase Details
Closed on
Jan 1, 1978
Purchase Details
Closed on
Sep 8, 1977
Bought by
Baker Waymon I
Purchase Details
Closed on
Mar 22, 1976
Purchase Details
Closed on
Nov 5, 1975
Similar Homes in Waynesboro, TN
Create a Home Valuation Report for This Property
The Home Valuation Report is an in-depth analysis detailing your home's value as well as a comparison with similar homes in the area
Home Values in the Area
Average Home Value in this Area
Purchase History
| Date | Type | Sale Price | Title Company |
|---|---|---|---|
| Warranty Deed | $55,000 | -- | |
| Warranty Deed | $7,750 | -- | |
| Warranty Deed | $12,000 | -- | |
| Warranty Deed | $28,000 | -- | |
| Warranty Deed | $22,500 | -- | |
| Deed | -- | -- | |
| Warranty Deed | $17,500 | -- | |
| Deed | -- | -- | |
| Deed | -- | -- | |
| Deed | -- | -- |
Source: Public Records
Mortgage History
| Date | Status | Loan Amount | Loan Type |
|---|---|---|---|
| Open | $168,686 | New Conventional | |
| Closed | $75,000 | New Conventional | |
| Closed | $63,000 | New Conventional | |
| Closed | $58,676 | New Conventional | |
| Previous Owner | $28,439 | Unknown |
Source: Public Records
Property History
| Date | Event | Price | Change | Sq Ft Price |
|---|---|---|---|---|
| 06/05/2025 06/05/25 | Sold | $167,000 | +1.2% | $148 / Sq Ft |
| 06/05/2025 06/05/25 | Pending | -- | -- | -- |
| 04/18/2025 04/18/25 | For Sale | $165,000 | -- | $147 / Sq Ft |
Source: Realtracs
Tax History Compared to Growth
Tax History
| Year | Tax Paid | Tax Assessment Tax Assessment Total Assessment is a certain percentage of the fair market value that is determined by local assessors to be the total taxable value of land and additions on the property. | Land | Improvement |
|---|---|---|---|---|
| 2024 | $390 | $17,975 | $750 | $17,225 |
| 2023 | $560 | $17,975 | $750 | $17,225 |
| 2022 | $560 | $17,975 | $750 | $17,225 |
| 2021 | $523 | $17,975 | $750 | $17,225 |
| 2020 | $523 | $13,950 | $750 | $13,200 |
| 2019 | $404 | $13,950 | $750 | $13,200 |
| 2018 | $503 | $13,950 | $750 | $13,200 |
| 2017 | $47 | $1,275 | $750 | $525 |
| 2016 | $44 | $1,275 | $750 | $525 |
| 2014 | $426 | $12,092 | $0 | $0 |
Source: Public Records
Agents Affiliated with this Home
-
Brandi Bundrant
Seller's Agent in 2025
Brandi Bundrant
United Country-Terry Realty
(731) 727-8444
139 Total Sales
Map
Source: Realtracs
MLS Number: 2904456
APN: 077K-B-013.00
Disclaimer: Certain information contained herein is derived from information provided by parties other than Homes.com. All information provided is deemed reliable, but is not guaranteed to be accurate and should be independently verified.
![]() Based on information submitted to the MLS GRID. All data is obtained from various sources and may not have been verified by broker or MLS GRID. Supplied Open House Information is subject to change without notice. All information should be independently reviewed and verified for accuracy. Properties may or may not be listed by the office/agent presenting the information. Some IDX listings have been excluded from this website.
Based on information submitted to the MLS GRID. All data is obtained from various sources and may not have been verified by broker or MLS GRID. Supplied Open House Information is subject to change without notice. All information should be independently reviewed and verified for accuracy. Properties may or may not be listed by the office/agent presenting the information. Some IDX listings have been excluded from this website.
The Digital Millennium Copyright Act of 1998, 17 U.S.C. § 512 (the “DMCA”) provides recourse for copyright owners who believe that material appearing on the Internet infringes their rights under U.S. copyright law. If you believe in good faith that any content or material made available in connection with our website or services infringes your copyright, you (or your agent) may send us a notice requesting that the content or material be removed, or access to it blocked.
Notices must be sent in writing by email to DMCAnotice@MLSGrid.com.
The DMCA requires that your notice of alleged copyright infringement include the following information:
(1) description of the copyrighted work that is the subject of claimed infringement;
(2) description of the alleged infringing content and information sufficient to permit us to locate the content;
(3) contact information for you, including your address, telephone number and email address;
(4) a statement by you that you have a good faith belief that the content in the manner complained of is not authorized by the copyright owner, or its agent, or by the operation of any law;
(5) a statement by you, signed under penalty of perjury, that the information in the notification is accurate and that you have the authority to enforce the copyrights that are claimed to be infringed; and
(6) a physical or electronic signature of the copyright owner or a person authorized to act on the copyright owner’s behalf. Failure to include all of the above information may result in the delay of the processing of your complaint.
Nearby Homes
- 107 W Songer St
- 117 Belew Cir
- 117 N High St
- 110 Turman St
- 311 W Hill St
- 446 Kilburn Hollow Rd
- 0 Waynesboro Hwy Unit RTC2821045
- 0 Waynesboro Hwy Unit RTC2806893
- 711 Hurricane Hill Dr
- 0 Simmons Branch Rd Unit 10181446
- 2130 Irwin Branch Rd
- 656 Waynesboro Hwy
- 123 Will Dr
- 159 Mindy Dr
- 152 W Mink Branch Rd
- 1272 Old Highway 64 E
- 910 Hassell Dr
- 1141 Lawrenceburg Hwy
- 0 Leonard Jackson Rd Unit RTC2866603
- 5011 Sunny Acres Dr