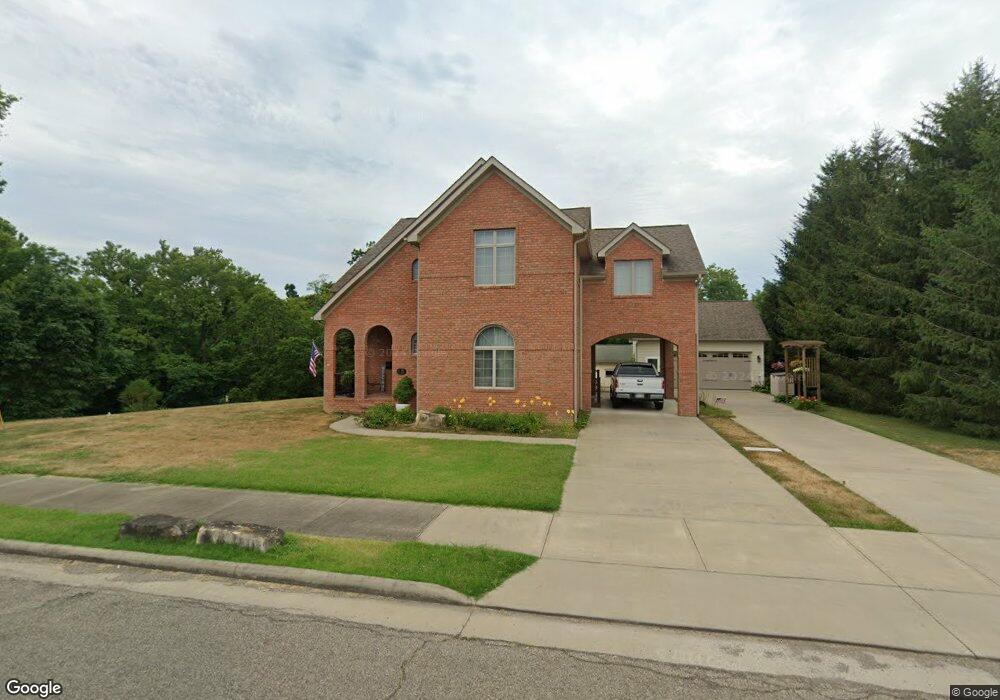
101 Walnut St Waverly, OH 45690
Estimated Value: $370,000 - $475,000
3
Beds
4
Baths
2,660
Sq Ft
$154/Sq Ft
Est. Value
About This Home
This home is located at 101 Walnut St, Waverly, OH 45690 and is currently estimated at $409,339, approximately $153 per square foot. 101 Walnut St is a home located in Pike County with nearby schools including Waverly Primary School, Waverly Intermediate School, and Waverly Junior High School.
Ownership History
Date
Name
Owned For
Owner Type
Purchase Details
Closed on
Nov 15, 2011
Sold by
Reed Mary Ann
Bought by
Sanders Henry Clay and Sanders Dona H
Current Estimated Value
Purchase Details
Closed on
Aug 15, 2011
Sold by
Kreider Velma
Bought by
Sanders Henry Clay and Sanders Dona H
Purchase Details
Closed on
Jul 27, 2006
Sold by
Estep Mary Ann
Bought by
Estep Kevin L
Purchase Details
Closed on
Dec 12, 2005
Sold by
Estep Kevin L
Bought by
Estep Mary Ann
Purchase Details
Closed on
Apr 26, 2005
Sold by
Estep Mary Ann
Bought by
Estep Mary Ann and Estep Kevin L
Create a Home Valuation Report for This Property
The Home Valuation Report is an in-depth analysis detailing your home's value as well as a comparison with similar homes in the area
Home Values in the Area
Average Home Value in this Area
Purchase History
| Date | Buyer | Sale Price | Title Company |
|---|---|---|---|
| Sanders Henry Clay | $28,500 | None Available | |
| Sanders Henry Clay | -- | None Available | |
| Estep Kevin L | -- | None Available | |
| Estep Mary Ann | -- | None Available | |
| Estep Mary Ann | -- | None Available |
Source: Public Records
Tax History Compared to Growth
Tax History
| Year | Tax Paid | Tax Assessment Tax Assessment Total Assessment is a certain percentage of the fair market value that is determined by local assessors to be the total taxable value of land and additions on the property. | Land | Improvement |
|---|---|---|---|---|
| 2024 | $3,725 | $114,830 | $7,510 | $107,320 |
| 2023 | $3,725 | $114,830 | $7,510 | $107,320 |
| 2022 | $3,906 | $104,480 | $7,860 | $96,620 |
| 2021 | $3,832 | $104,480 | $7,860 | $96,620 |
| 2020 | $3,834 | $104,480 | $7,860 | $96,620 |
| 2019 | $3,226 | $88,580 | $6,700 | $81,880 |
| 2018 | $2,430 | $88,580 | $6,700 | $81,880 |
| 2017 | $2,509 | $93,860 | $4,360 | $89,500 |
| 2016 | $1,639 | $48,480 | $7,570 | $40,910 |
| 2015 | $1,639 | $48,480 | $7,570 | $40,910 |
| 2014 | $1,424 | $44,420 | $7,570 | $36,850 |
| 2013 | $306 | $7,570 | $7,570 | $0 |
| 2012 | $650 | $15,690 | $6,940 | $8,750 |
Source: Public Records
Map
Nearby Homes