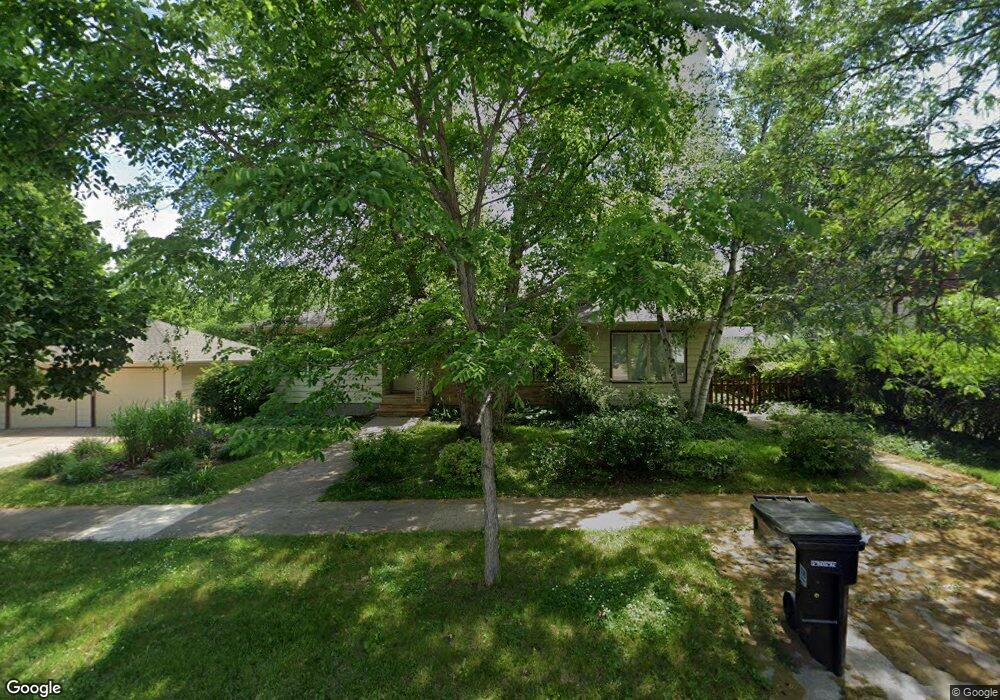
1010 College St Cedar Falls, IA 50613
Estimated Value: $212,000 - $281,000
3
Beds
2
Baths
1,598
Sq Ft
$156/Sq Ft
Est. Value
About This Home
This home is located at 1010 College St, Cedar Falls, IA 50613 and is currently estimated at $250,066, approximately $156 per square foot. 1010 College St is a home located in Black Hawk County with nearby schools including Lincoln Elementary School, Holmes Junior High School, and Cedar Falls High School.
Ownership History
Date
Name
Owned For
Owner Type
Purchase Details
Closed on
Jun 1, 2012
Sold by
Flory Heather
Bought by
Hakanson Josh and Altstaff Alison
Current Estimated Value
Purchase Details
Closed on
May 17, 2012
Sold by
Fischer Robert L and Fischer Julie B
Bought by
Flory Heather
Create a Home Valuation Report for This Property
The Home Valuation Report is an in-depth analysis detailing your home's value as well as a comparison with similar homes in the area
Home Values in the Area
Average Home Value in this Area
Purchase History
| Date | Buyer | Sale Price | Title Company |
|---|---|---|---|
| Hakanson Josh | $168,000 | None Available | |
| Flory Heather | $150,000 | None Available |
Source: Public Records
Tax History Compared to Growth
Tax History
| Year | Tax Paid | Tax Assessment Tax Assessment Total Assessment is a certain percentage of the fair market value that is determined by local assessors to be the total taxable value of land and additions on the property. | Land | Improvement |
|---|---|---|---|---|
| 2025 | $3,602 | $261,670 | $65,970 | $195,700 |
| 2024 | $3,602 | $231,210 | $42,410 | $188,800 |
| 2023 | $3,378 | $231,210 | $42,410 | $188,800 |
| 2022 | $3,416 | $189,380 | $42,410 | $146,970 |
| 2021 | $3,192 | $189,380 | $42,410 | $146,970 |
| 2020 | $3,126 | $177,600 | $30,630 | $146,970 |
| 2019 | $6,160 | $177,600 | $30,630 | $146,970 |
| 2018 | $3,120 | $177,600 | $30,630 | $146,970 |
| 2017 | $3,192 | $177,600 | $30,630 | $146,970 |
| 2016 | $2,984 | $177,600 | $30,630 | $146,970 |
| 2015 | $2,984 | $177,600 | $30,630 | $146,970 |
| 2014 | $2,900 | $170,920 | $30,630 | $140,290 |
Source: Public Records
Map
Nearby Homes