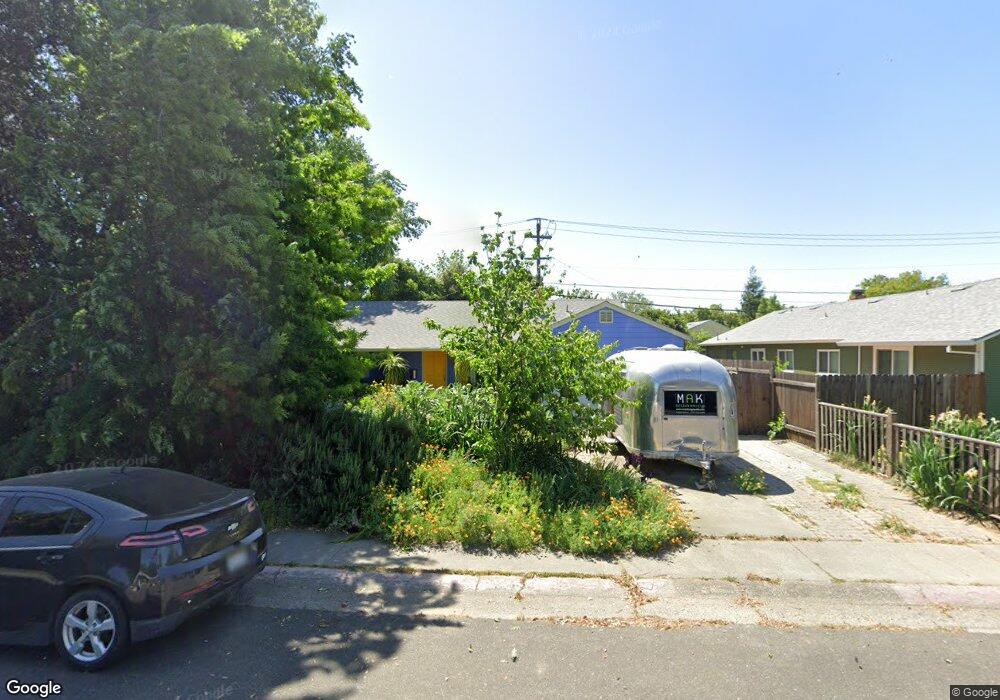
1010 E 8th St Davis, CA 95616
Central Davis NeighborhoodEstimated Value: $585,000 - $758,000
3
Beds
1
Bath
1,221
Sq Ft
$547/Sq Ft
Est. Value
About This Home
This home is located at 1010 E 8th St, Davis, CA 95616 and is currently estimated at $667,791, approximately $546 per square foot. 1010 E 8th St is a home located in Yolo County with nearby schools including North Davis Elementary School, Oliver Wendell Holmes Junior High School, and Davis Senior High School.
Ownership History
Date
Name
Owned For
Owner Type
Purchase Details
Closed on
Jun 21, 2013
Sold by
Kirsch Kenneth A and Moriarty Ellen R
Bought by
Kirsch Kenneth Anthony and Moriarty Ellen Rogers
Current Estimated Value
Purchase Details
Closed on
Sep 21, 2000
Sold by
Brandon George A & Dona L Tr and Lee Dona
Bought by
Kirsch Kenneth A and Moriarty Ellen R
Home Financials for this Owner
Home Financials are based on the most recent Mortgage that was taken out on this home.
Original Mortgage
$152,000
Outstanding Balance
$54,927
Interest Rate
7.98%
Estimated Equity
$612,864
Create a Home Valuation Report for This Property
The Home Valuation Report is an in-depth analysis detailing your home's value as well as a comparison with similar homes in the area
Home Values in the Area
Average Home Value in this Area
Purchase History
| Date | Buyer | Sale Price | Title Company |
|---|---|---|---|
| Kirsch Kenneth Anthony | -- | None Available | |
| Kirsch Kenneth A | $190,000 | Fidelity National Title Co |
Source: Public Records
Mortgage History
| Date | Status | Borrower | Loan Amount |
|---|---|---|---|
| Open | Kirsch Kenneth A | $152,000 | |
| Closed | Kirsch Kenneth A | $19,000 |
Source: Public Records
Tax History
| Year | Tax Paid | Tax Assessment Tax Assessment Total Assessment is a certain percentage of the fair market value that is determined by local assessors to be the total taxable value of land and additions on the property. | Land | Improvement |
|---|---|---|---|---|
| 2025 | $4,647 | $301,486 | $135,602 | $165,884 |
| 2023 | $4,647 | $289,782 | $130,338 | $159,444 |
| 2022 | $4,435 | $284,101 | $127,783 | $156,318 |
| 2021 | $4,316 | $278,531 | $125,278 | $153,253 |
| 2020 | $4,240 | $275,676 | $123,994 | $151,682 |
| 2019 | $3,969 | $270,271 | $121,563 | $148,708 |
| 2018 | $3,713 | $264,973 | $119,180 | $145,793 |
| 2017 | $3,629 | $259,779 | $116,844 | $142,935 |
| 2016 | $3,435 | $249,986 | $114,553 | $135,433 |
| 2015 | $3,319 | $246,232 | $112,833 | $133,399 |
| 2014 | $3,319 | $241,409 | $110,623 | $130,786 |
Source: Public Records
Map
Nearby Homes
Your Personal Tour Guide
Ask me questions while you tour the home.