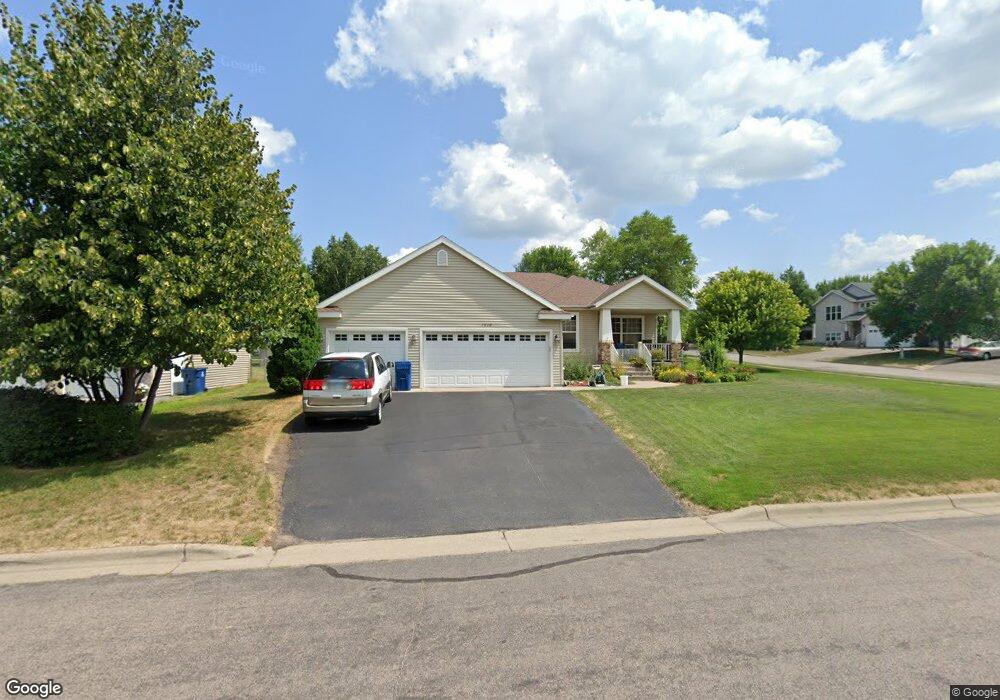
1010 Hillside Rd Sauk Rapids, MN 56379
Estimated Value: $368,000 - $449,000
5
Beds
2
Baths
1,740
Sq Ft
$229/Sq Ft
Est. Value
About This Home
This home is located at 1010 Hillside Rd, Sauk Rapids, MN 56379 and is currently estimated at $398,445, approximately $228 per square foot. 1010 Hillside Rd is a home located in Benton County with nearby schools including Mississippi Heights Elementary School, Sauk Rapids-Rice Middle School, and Sauk Rapids-Rice Senior High School.
Ownership History
Date
Name
Owned For
Owner Type
Purchase Details
Closed on
Jun 5, 2009
Sold by
Nelson Todd P and Nelson Deanna L
Bought by
Nelson Family Trust
Current Estimated Value
Home Financials for this Owner
Home Financials are based on the most recent Mortgage that was taken out on this home.
Original Mortgage
$209,600
Outstanding Balance
$132,856
Interest Rate
4.83%
Mortgage Type
New Conventional
Estimated Equity
$265,589
Purchase Details
Closed on
Jan 10, 2008
Sold by
Nelson Todd P and Nelson Deanna L
Bought by
Nelson Todd Paul and Nelson Deanna Lee
Purchase Details
Closed on
Dec 15, 2006
Sold by
Kummer Gregory A and Kummer Carla R
Bought by
Nelson Todd P and Nelson Deanna L
Home Financials for this Owner
Home Financials are based on the most recent Mortgage that was taken out on this home.
Original Mortgage
$216,675
Interest Rate
6.36%
Mortgage Type
New Conventional
Create a Home Valuation Report for This Property
The Home Valuation Report is an in-depth analysis detailing your home's value as well as a comparison with similar homes in the area
Home Values in the Area
Average Home Value in this Area
Purchase History
| Date | Buyer | Sale Price | Title Company |
|---|---|---|---|
| Nelson Family Trust | -- | -- | |
| Nelson Todd P | -- | -- | |
| Nelson Todd Paul | -- | -- | |
| Nelson Todd P | $288,900 | -- |
Source: Public Records
Mortgage History
| Date | Status | Borrower | Loan Amount |
|---|---|---|---|
| Open | Nelson Todd P | $209,600 | |
| Previous Owner | Nelson Todd P | $216,675 |
Source: Public Records
Tax History
| Year | Tax Paid | Tax Assessment Tax Assessment Total Assessment is a certain percentage of the fair market value that is determined by local assessors to be the total taxable value of land and additions on the property. | Land | Improvement |
|---|---|---|---|---|
| 2025 | $4,850 | $400,500 | $31,100 | $369,400 |
| 2024 | $5,084 | $385,900 | $31,100 | $354,800 |
| 2023 | $4,816 | $416,700 | $31,100 | $385,600 |
| 2022 | $4,490 | $362,600 | $28,300 | $334,300 |
| 2021 | $4,094 | $310,100 | $28,300 | $281,800 |
| 2018 | $3,620 | $238,600 | $25,642 | $212,958 |
| 2017 | $3,620 | $221,300 | $25,377 | $195,923 |
| 2016 | $3,514 | $231,700 | $27,200 | $204,500 |
| 2015 | $3,560 | $198,000 | $24,956 | $173,044 |
| 2014 | -- | $188,600 | $24,758 | $163,842 |
| 2013 | -- | $190,600 | $24,805 | $165,795 |
Source: Public Records
Map
Nearby Homes
- 1000 Brook Ct
- 1300 10th St NE
- 1408 10th St NE
- 1004 Marcella Ct
- 1000 10th Ave NE
- 1294 Stone Ridge Rd
- 1271 Stone Ridge Rd
- 423 13th Ave S
- 1021 5th St S
- 1545 18th St NE
- 936 5th St S
- 1930 Prospect Dr NE
- xxx Lot 3
- 31 12th Ave NE
- 507 5th St S
- 116 Columbia Ave NE
- 1526 Prairie View Ln NE
- 608 Summit Ave S
- 1525 Park View Ln NE
- xxx Lot 2
- 1016 Hillside Rd
- 1409 Hillside Ct
- 1400 Hillside Ct
- 1020 Hillside Rd
- 1404 Hillside Ct
- 1013 Hillside Rd
- 1009 Hillside Rd
- 1017 Hillside Rd
- 1408 Hillside Ct
- 1005 Hillside Rd
- 1023 Meadows Dr
- 1021 Hillside Rd
- 1412 Hillside Ct
- 1001 Hillside Rd
- 1415 Hillside Ct
- 1028 Hillside Rd
- 1025 Hillside Rd
- 1027 Meadows Dr
- 1006 Brook Ct
- 1002 Brook Ct
Your Personal Tour Guide
Ask me questions while you tour the home.