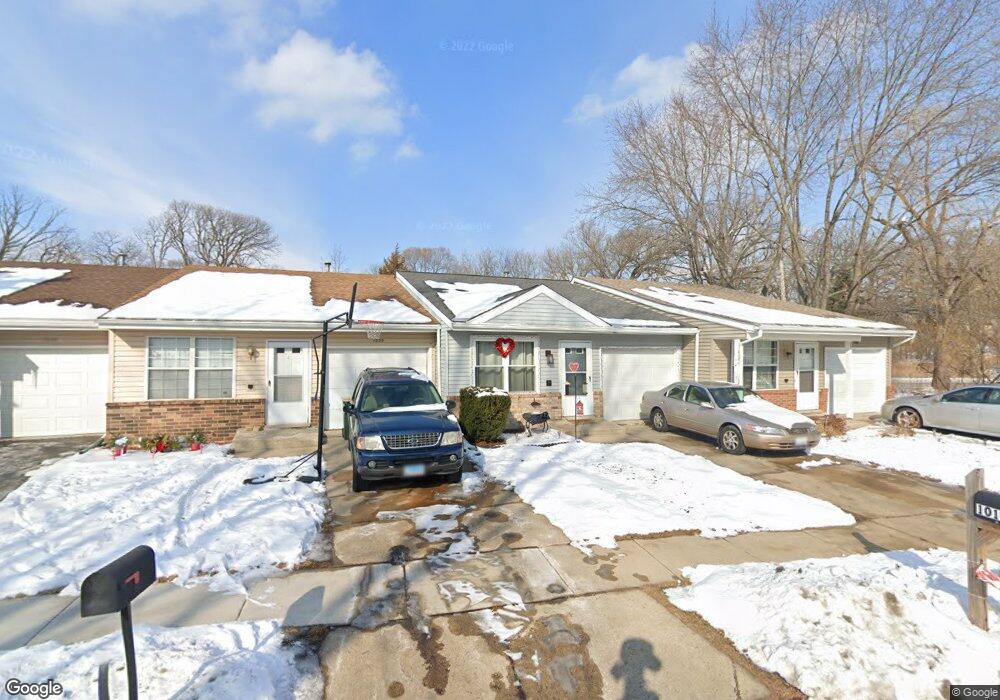
1010 Stratford Ln Algonquin, IL 60102
Estimated Value: $216,771 - $247,000
2
Beds
--
Bath
712
Sq Ft
$331/Sq Ft
Est. Value
About This Home
This home is located at 1010 Stratford Ln, Algonquin, IL 60102 and is currently estimated at $235,943, approximately $331 per square foot. 1010 Stratford Ln is a home located in Kane County with nearby schools including Algonquin Lakes Elementary School, Algonquin Middle School, and Dundee-Crown High School.
Ownership History
Date
Name
Owned For
Owner Type
Purchase Details
Closed on
Oct 16, 2006
Sold by
Krolak Jeffery and Krolak Judith
Bought by
Greenholdt Mark J and Moret Francois R
Current Estimated Value
Home Financials for this Owner
Home Financials are based on the most recent Mortgage that was taken out on this home.
Original Mortgage
$131,650
Outstanding Balance
$78,732
Interest Rate
6.5%
Mortgage Type
Purchase Money Mortgage
Estimated Equity
$157,211
Purchase Details
Closed on
Aug 9, 2000
Sold by
Kretschmer Carmen
Bought by
Krolak Jeffrey and Krolak Judy Ann
Home Financials for this Owner
Home Financials are based on the most recent Mortgage that was taken out on this home.
Original Mortgage
$117,319
Interest Rate
8.12%
Mortgage Type
Purchase Money Mortgage
Create a Home Valuation Report for This Property
The Home Valuation Report is an in-depth analysis detailing your home's value as well as a comparison with similar homes in the area
Purchase History
| Date | Buyer | Sale Price | Title Company |
|---|---|---|---|
| Greenholdt Mark J | $168,500 | Law Title Oak Brook | |
| Krolak Jeffrey | $117,500 | Heritage Title |
Source: Public Records
Mortgage History
| Date | Status | Borrower | Loan Amount |
|---|---|---|---|
| Open | Greenholdt Mark J | $131,650 | |
| Previous Owner | Krolak Jeffrey | $117,319 |
Source: Public Records
Tax History
| Year | Tax Paid | Tax Assessment Tax Assessment Total Assessment is a certain percentage of the fair market value that is determined by local assessors to be the total taxable value of land and additions on the property. | Land | Improvement |
|---|---|---|---|---|
| 2024 | $4,578 | $58,245 | $8,371 | $49,874 |
| 2023 | $4,410 | $52,407 | $7,532 | $44,875 |
| 2022 | $4,441 | $51,402 | $7,532 | $43,870 |
| 2021 | $4,324 | $48,534 | $7,112 | $41,422 |
| 2020 | $4,250 | $47,443 | $6,952 | $40,491 |
| 2019 | $4,131 | $45,038 | $6,600 | $38,438 |
| 2018 | $3,597 | $37,674 | $6,469 | $31,205 |
| 2017 | $3,488 | $35,242 | $6,051 | $29,191 |
| 2016 | $3,583 | $34,123 | $5,859 | $28,264 |
| 2015 | -- | $31,974 | $5,490 | $26,484 |
| 2014 | -- | $31,091 | $5,338 | $25,753 |
| 2013 | -- | $37,559 | $5,501 | $32,058 |
Source: Public Records
Map
Nearby Homes
- 1420 Greenridge Ave
- lot 25 Wabican Trail
- 719 Webster St
- 0 Natoma Trail
- Lot 4 b Ryan Pkwy
- 1770 E Algonquin Rd
- 1188 E Algonquin Rd
- 600 E Algonquin Rd
- 1031 Timberwood Ln
- 1923 Ozark Pkwy
- 953 Old Oak Cir
- 1906 Ozark Pkwy
- 1782 Cumberland Pkwy
- 1321 Big Sur Pkwy
- 2 Cumberland Pkwy
- 2027 Teton Pkwy
- 2150 E Algonquin Rd
- Lot #3-5 Hayes Rd
- 407 La Fox River Dr
- 21 Division St
- 1020 Stratford Ln Unit 2
- 1030 Stratford Ln
- 1000 Stratford Ln
- 1000 Stratford Ln Unit C1
- 1100 Stratford Ln Unit 2
- 1102 Stratford Ln
- 1104 Stratford Ln
- 1102 Riverwood Dr Unit 2
- 1104 Riverwood Dr
- 1106 Riverwood Dr
- 1100 Riverwood Dr
- 1106 Stratford Ln
- 1110 Riverwood Dr
- 1112 Riverwood Dr
- 1108 Stratford Ln
- 933 Linda Dr
- 1114 Riverwood Dr
- 1114 Riverwood Dr Unit 1112
- 1110 Stratford Ln
- 1110 Stratford Ln Unit 1
Your Personal Tour Guide
Ask me questions while you tour the home.