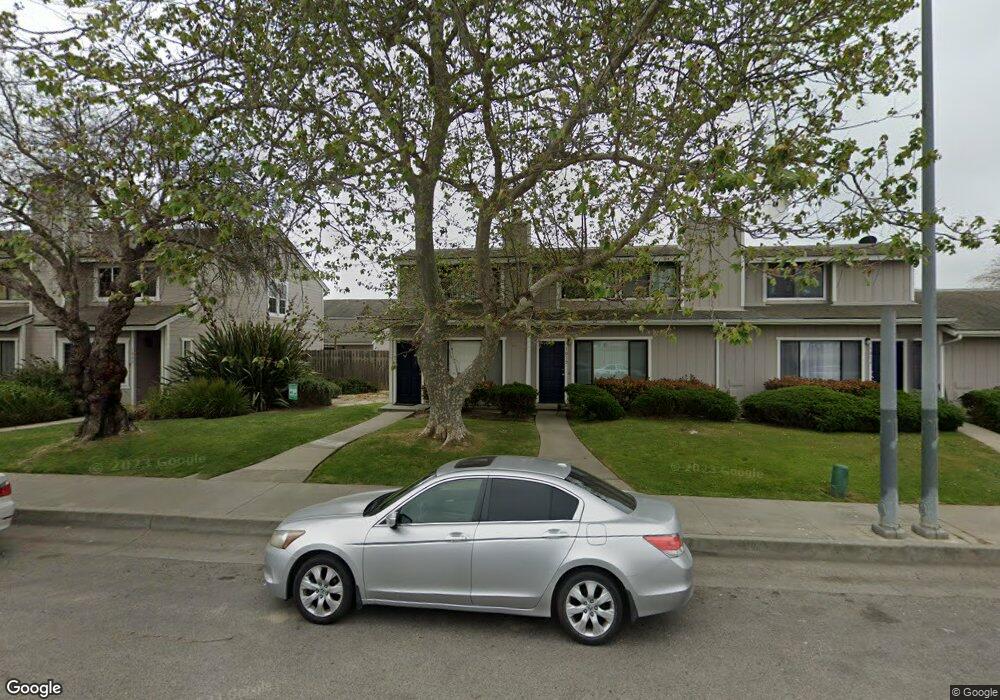
1010 W Chestnut Ave Unit 29 Lompoc, CA 93436
Estimated Value: $336,000 - $377,000
2
Beds
2
Baths
1,002
Sq Ft
$354/Sq Ft
Est. Value
About This Home
This home is located at 1010 W Chestnut Ave Unit 29, Lompoc, CA 93436 and is currently estimated at $354,809, approximately $354 per square foot. 1010 W Chestnut Ave Unit 29 is a home located in Santa Barbara County with nearby schools including Miguelito Elementary School, Lompoc Valley Middle School, and Lompoc High School.
Ownership History
Date
Name
Owned For
Owner Type
Purchase Details
Closed on
Jul 28, 2004
Sold by
Churchman Randal C
Bought by
Churchman Randal C and Churchman Joann
Current Estimated Value
Home Financials for this Owner
Home Financials are based on the most recent Mortgage that was taken out on this home.
Original Mortgage
$125,000
Outstanding Balance
$61,192
Interest Rate
6.24%
Mortgage Type
New Conventional
Estimated Equity
$293,617
Purchase Details
Closed on
Jun 18, 2002
Sold by
Churchman Randal C and Wheatley Joann Churchman
Bought by
Churchman Randal C
Home Financials for this Owner
Home Financials are based on the most recent Mortgage that was taken out on this home.
Original Mortgage
$72,000
Interest Rate
6.86%
Purchase Details
Closed on
Jun 8, 1999
Sold by
Ringer Thomas L and Ringer Joyce L
Bought by
Midfirst Bank and Midfirst Bank Ssb
Purchase Details
Closed on
Apr 12, 1996
Sold by
Churchman Randal C and Churchman Mitzi G
Bought by
Churchman Randal C
Create a Home Valuation Report for This Property
The Home Valuation Report is an in-depth analysis detailing your home's value as well as a comparison with similar homes in the area
Home Values in the Area
Average Home Value in this Area
Purchase History
| Date | Buyer | Sale Price | Title Company |
|---|---|---|---|
| Churchman Randal C | -- | New Century Title | |
| Churchman Randal C | -- | American Title Co | |
| Midfirst Bank | $69,437 | United Title Company | |
| Churchman Randal C | -- | -- |
Source: Public Records
Mortgage History
| Date | Status | Borrower | Loan Amount |
|---|---|---|---|
| Open | Churchman Randal C | $125,000 | |
| Closed | Churchman Randal C | $72,000 |
Source: Public Records
Tax History
| Year | Tax Paid | Tax Assessment Tax Assessment Total Assessment is a certain percentage of the fair market value that is determined by local assessors to be the total taxable value of land and additions on the property. | Land | Improvement |
|---|---|---|---|---|
| 2025 | $1,451 | $131,510 | $52,524 | $78,986 |
| 2023 | $1,451 | $126,406 | $50,486 | $75,920 |
| 2022 | $1,426 | $123,929 | $49,497 | $74,432 |
| 2021 | $1,441 | $121,500 | $48,527 | $72,973 |
| 2020 | $1,426 | $120,255 | $48,030 | $72,225 |
| 2019 | $1,402 | $117,898 | $47,089 | $70,809 |
| 2018 | $1,380 | $115,587 | $46,166 | $69,421 |
| 2017 | $1,355 | $113,321 | $45,261 | $68,060 |
| 2016 | $1,330 | $111,100 | $44,374 | $66,726 |
| 2015 | $1,320 | $109,432 | $43,708 | $65,724 |
| 2014 | -- | $107,289 | $42,852 | $64,437 |
Source: Public Records
Map
Nearby Homes
- 1014 W Chestnut Ave
- 1032 W Chestnut Ave Unit 30
- 1030 W Chestnut Ave
- 1002 W Chestnut Ave
- 1028 W Chestnut Ave
- 1036 W Chestnut Ave Unit W
- 1036 W Chestnut Ave
- 1026 W Chestnut Ave
- 232 N R St Unit 3
- 234 N R St
- 1022 W Chestnut Ave
- 1020 W Chestnut Ave
- 222 N R St
- 208 N R St
- 226 N R St
- 1031 W Walnut Ave
- 1035 W Walnut Ave
- 1013 W Walnut Ave
Your Personal Tour Guide
Ask me questions while you tour the home.