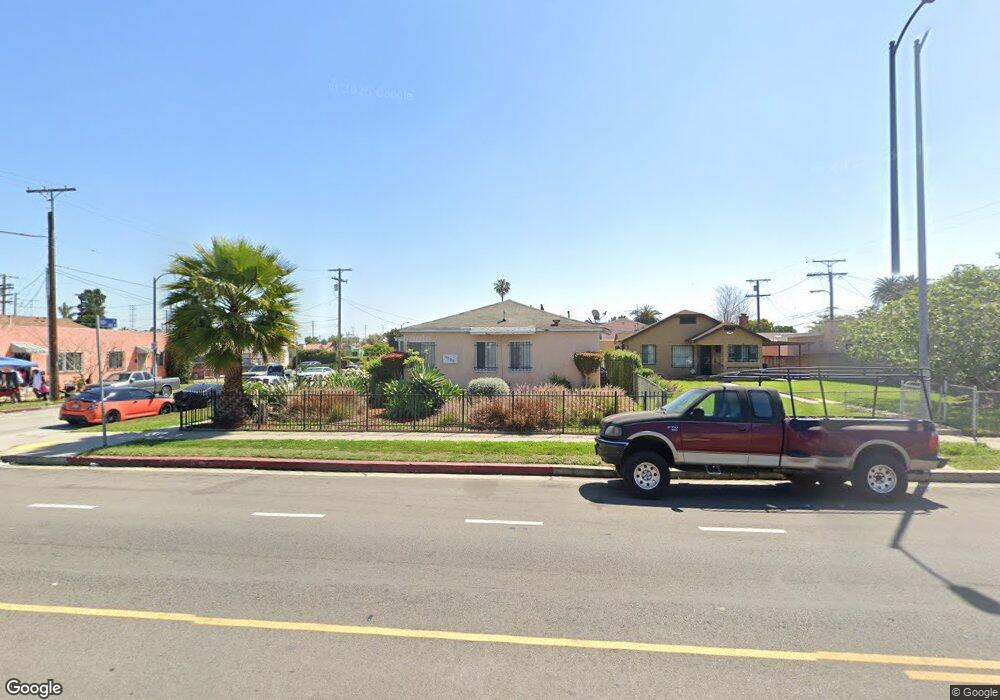
10100 S Hoover St Los Angeles, CA 90044
Vermont Vista NeighborhoodEstimated Value: $765,000 - $838,000
8
Beds
4
Baths
2,375
Sq Ft
$336/Sq Ft
Est. Value
About This Home
This home is located at 10100 S Hoover St, Los Angeles, CA 90044 and is currently estimated at $798,000, approximately $336 per square foot. 10100 S Hoover St is a home located in Los Angeles County with nearby schools including Charles W. Barrett Elementary School, Bret Harte Preparatory Middle School, and Alliance College-Ready Middle Academy No. 4.
Ownership History
Date
Name
Owned For
Owner Type
Purchase Details
Closed on
Feb 13, 2009
Sold by
Deutsche Bank National Trust Company
Bought by
Carter Murry J
Current Estimated Value
Purchase Details
Closed on
Jun 20, 2008
Sold by
Ferrette Marcus S and Ferrette Phelnon M
Bought by
Deutsche Bank National Trust Co and Imh Assets Corp Collateralized Asset Bac
Purchase Details
Closed on
May 22, 2008
Sold by
Ferrette Marcus S and Ferrette Phelnon M
Bought by
Richard Winston Llc
Purchase Details
Closed on
Jan 11, 2005
Sold by
Adams Jewelean Thomas
Bought by
Ferrette Marcus S
Home Financials for this Owner
Home Financials are based on the most recent Mortgage that was taken out on this home.
Original Mortgage
$262,500
Interest Rate
6.56%
Mortgage Type
Purchase Money Mortgage
Create a Home Valuation Report for This Property
The Home Valuation Report is an in-depth analysis detailing your home's value as well as a comparison with similar homes in the area
Home Values in the Area
Average Home Value in this Area
Purchase History
| Date | Buyer | Sale Price | Title Company |
|---|---|---|---|
| Carter Murry J | $260,000 | First American Title Ins Co | |
| Deutsche Bank National Trust Co | $282,255 | None Available | |
| Richard Winston Llc | $20,000 | None Available | |
| Ferrette Marcus S | $375,000 | Gateway Title Company |
Source: Public Records
Mortgage History
| Date | Status | Borrower | Loan Amount |
|---|---|---|---|
| Previous Owner | Ferrette Marcus S | $262,500 | |
| Closed | Ferrette Marcus S | $93,750 |
Source: Public Records
Tax History Compared to Growth
Tax History
| Year | Tax Paid | Tax Assessment Tax Assessment Total Assessment is a certain percentage of the fair market value that is determined by local assessors to be the total taxable value of land and additions on the property. | Land | Improvement |
|---|---|---|---|---|
| 2025 | $5,696 | $437,822 | $347,687 | $90,135 |
| 2024 | $5,696 | $429,238 | $340,870 | $88,368 |
| 2023 | $5,598 | $420,823 | $334,187 | $86,636 |
| 2022 | $5,357 | $412,573 | $327,635 | $84,938 |
| 2021 | $5,281 | $404,484 | $321,211 | $83,273 |
| 2019 | $5,134 | $392,489 | $311,685 | $80,804 |
| 2018 | $5,041 | $384,794 | $305,574 | $79,220 |
| 2016 | $4,812 | $369,854 | $293,709 | $76,145 |
| 2015 | $4,746 | $364,300 | $289,298 | $75,002 |
| 2014 | $4,789 | $357,165 | $283,632 | $73,533 |
Source: Public Records
Map
Nearby Homes
- 624 W 102nd St
- 600 W 102nd St
- 739 W 102nd St
- 10405 S Hoover St
- 719 W Century Blvd
- 637 W 105th St
- 514 W 102nd St
- 812 W 103rd St
- 556 W 99th St
- 10311 S Figueroa St
- 837 W 103rd St
- 738 W 105th St
- 747 W 99th St
- 10210 S Figueroa St
- 547 W 106th St
- 10412 S Figueroa St
- 422 W 102nd St
- 760 W 97th St
- 418 W 101st St
- 433 W Century Blvd
- 10106 S Hoover St
- 10112 S Hoover St
- 640 W 101st St
- 10032 S Hoover St
- 10022 S Hoover St
- 638 W 101st St
- 651 W 102nd St
- 655 W 102nd St
- 647 W 102nd St
- 704 W 101st St
- 643 W 101st St
- 10018 S Hoover St
- 634 W 101st St
- 639 W 102nd St
- 639 W 101st St
- 10107 S Hoover St Unit 3
- 10107 S Hoover St
- 10023 S Hoover St
- 10023 S Hoover St
- 10023 S Hoover St Unit A