
Seller's Agent in 2018
Sean Burcham
Coldwell Banker Real Estate Group
(765) 748-0061
59 Total Sales
Estimated Value: $58,789 - $138,000
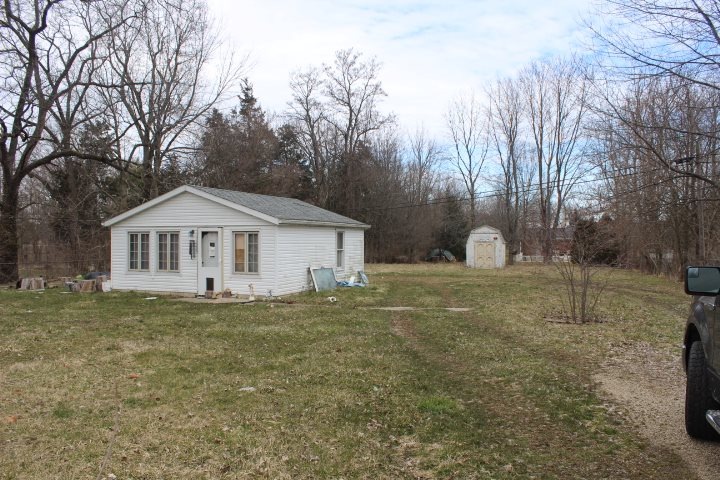
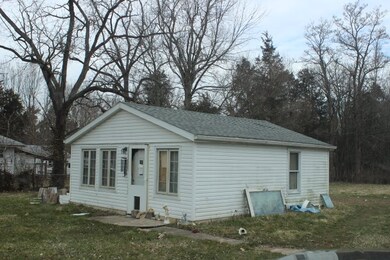
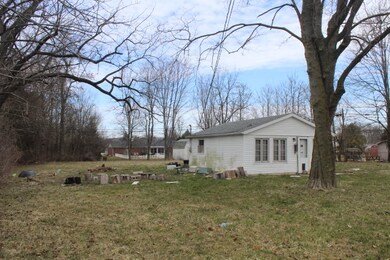
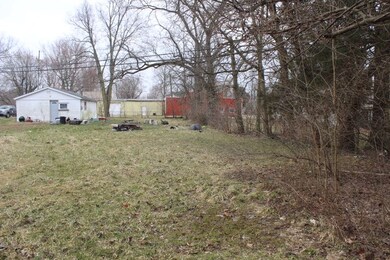
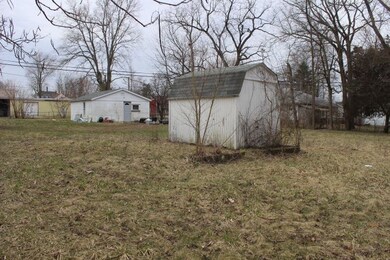
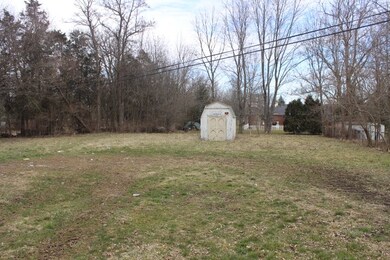
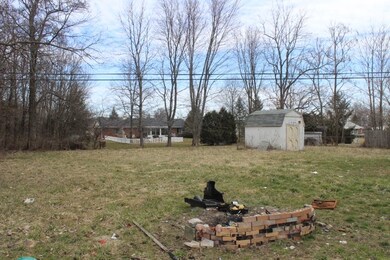
You are buying this property 'as is'. The house is uninhabitable. You are buying the lot. It has city water and sewage.
Last Agent to Sell the Property
Coldwell Banker Real Estate Group Listed on: 03/20/2018
| Date | Buyer | Sale Price | Title Company |
|---|---|---|---|
| Moore Tyler M | -- | None Listed On Document | |
| Snyder Homes Inc | -- | None Available | |
| Smith Family Farms Partnership | -- | Youngs Title |
| Date | Status | Borrower | Loan Amount |
|---|---|---|---|
| Open | Moore Tyler M | $36,000 | |
| Previous Owner | Snyder Homes Inc | $24,000 |
| Date | Event | Price | List to Sale | Price per Sq Ft |
|---|---|---|---|---|
| 05/01/2018 05/01/18 | Sold | $8,100 | +2.5% | $17 / Sq Ft |
| 03/27/2018 03/27/18 | Pending | -- | -- | -- |
| 03/20/2018 03/20/18 | For Sale | $7,900 | -- | $16 / Sq Ft |
| Year | Tax Paid | Tax Assessment Tax Assessment Total Assessment is a certain percentage of the fair market value that is determined by local assessors to be the total taxable value of land and additions on the property. | Land | Improvement |
|---|---|---|---|---|
| 2025 | $283 | $38,400 | $14,500 | $23,900 |
| 2024 | $283 | $33,600 | $14,500 | $19,100 |
| 2023 | $304 | $38,600 | $14,500 | $24,100 |
| 2022 | $255 | $38,900 | $14,500 | $24,400 |
| 2021 | $241 | $33,700 | $15,200 | $18,500 |
| 2020 | $776 | $33,700 | $15,200 | $18,500 |
| 2019 | $728 | $31,300 | $14,500 | $16,800 |
| 2018 | $728 | $31,300 | $14,500 | $16,800 |
| 2017 | $764 | $33,000 | $16,000 | $17,000 |
| 2016 | $801 | $34,900 | $16,000 | $18,900 |
| 2014 | $701 | $34,400 | $16,000 | $18,400 |
| 2013 | -- | $34,200 | $16,000 | $18,200 |
Seller's Agent in 2018
Sean Burcham
Coldwell Banker Real Estate Group
(765) 748-0061
59 Total Sales
Source: Indiana Regional MLS
MLS Number: 201810480
APN: 18-12-10-378-013.000-011
Disclaimer: Certain information contained herein is derived from information provided by parties other than Homes.com. All information provided is deemed reliable, but is not guaranteed to be accurate and should be independently verified.
![]() Based on information submitted to the MLS GRID. All data is obtained from various sources and may not have been verified by broker or MLS GRID. Supplied Open House Information is subject to change without notice. All information should be independently reviewed and verified for accuracy. Properties may or may not be listed by the office/agent presenting the information. Some IDX listings have been excluded from this website. IDX information is provided exclusively for personal, non-commercial use, and may not be used for any purpose other than to identify prospective properties consumers may be interested in purchasing. Information is deemed reliable but not guaranteed.
Based on information submitted to the MLS GRID. All data is obtained from various sources and may not have been verified by broker or MLS GRID. Supplied Open House Information is subject to change without notice. All information should be independently reviewed and verified for accuracy. Properties may or may not be listed by the office/agent presenting the information. Some IDX listings have been excluded from this website. IDX information is provided exclusively for personal, non-commercial use, and may not be used for any purpose other than to identify prospective properties consumers may be interested in purchasing. Information is deemed reliable but not guaranteed.
Based on information submitted to the MLS GRID
Ask me questions while you tour the home.