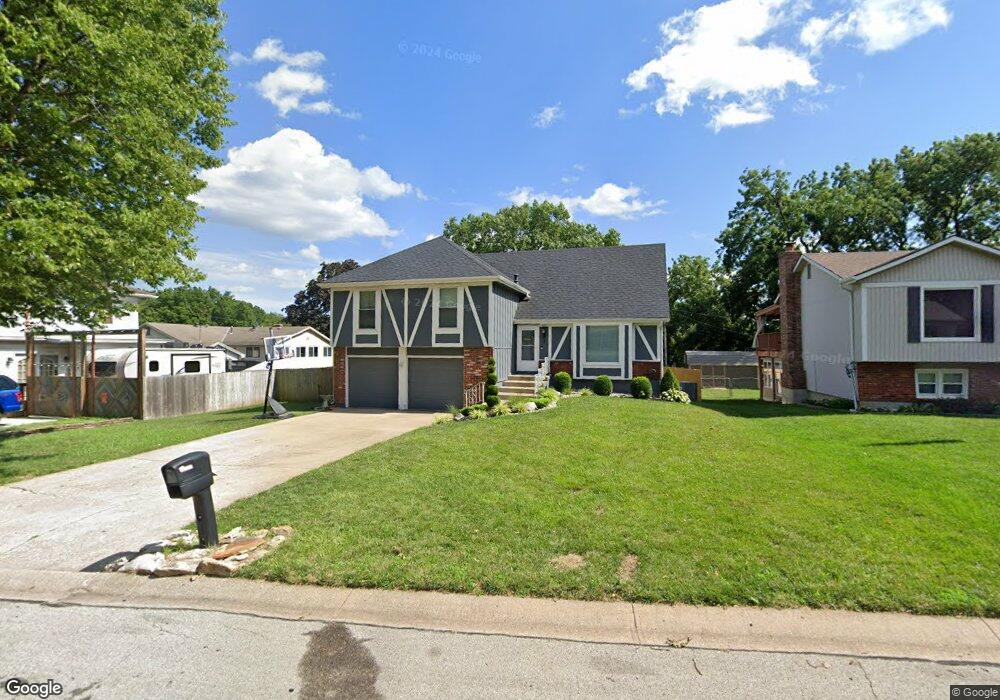
10105 W 54th St Shawnee, KS 66203
Estimated Value: $334,000 - $343,000
4
Beds
2
Baths
1,556
Sq Ft
$217/Sq Ft
Est. Value
About This Home
This home is located at 10105 W 54th St, Shawnee, KS 66203 and is currently estimated at $337,145, approximately $216 per square foot. 10105 W 54th St is a home located in Johnson County with nearby schools including Merriam Park Elementary School, Hocker Grove Middle School, and Shawnee Mission North High School.
Ownership History
Date
Name
Owned For
Owner Type
Purchase Details
Closed on
Apr 28, 2011
Sold by
Hsbc Mortgage Services Inc
Bought by
Hernandez Jose Leonardo
Current Estimated Value
Home Financials for this Owner
Home Financials are based on the most recent Mortgage that was taken out on this home.
Original Mortgage
$115,443
Outstanding Balance
$5,197
Interest Rate
4.4%
Mortgage Type
FHA
Estimated Equity
$331,948
Purchase Details
Closed on
Dec 21, 2010
Sold by
Greer Brian and Greer Tonya
Bought by
Hsbc Mortgage Services Inc
Purchase Details
Closed on
Jul 16, 2003
Sold by
Clarensau Ted and Frances Clarensau M
Bought by
Greer Brian J and Greer Tonya
Home Financials for this Owner
Home Financials are based on the most recent Mortgage that was taken out on this home.
Original Mortgage
$171,588
Interest Rate
5.19%
Mortgage Type
FHA
Create a Home Valuation Report for This Property
The Home Valuation Report is an in-depth analysis detailing your home's value as well as a comparison with similar homes in the area
Home Values in the Area
Average Home Value in this Area
Purchase History
| Date | Buyer | Sale Price | Title Company |
|---|---|---|---|
| Hernandez Jose Leonardo | $127,000 | Chicago Title Ins Co | |
| Hsbc Mortgage Services Inc | $119,643 | First American Title Ins Co | |
| Greer Brian J | -- | Chicago Title Insurance Co |
Source: Public Records
Mortgage History
| Date | Status | Borrower | Loan Amount |
|---|---|---|---|
| Open | Hernandez Jose Leonardo | $115,443 | |
| Previous Owner | Greer Brian J | $171,588 |
Source: Public Records
Tax History Compared to Growth
Tax History
| Year | Tax Paid | Tax Assessment Tax Assessment Total Assessment is a certain percentage of the fair market value that is determined by local assessors to be the total taxable value of land and additions on the property. | Land | Improvement |
|---|---|---|---|---|
| 2024 | $3,414 | $32,085 | $5,040 | $27,045 |
| 2023 | $3,193 | $30,532 | $5,040 | $25,492 |
| 2022 | $3,224 | $29,670 | $4,577 | $25,093 |
| 2021 | $3,224 | $25,564 | $4,157 | $21,407 |
| 2020 | $2,528 | $22,115 | $3,618 | $18,497 |
| 2019 | $2,216 | $19,412 | $3,145 | $16,267 |
| 2018 | $2,108 | $18,400 | $2,854 | $15,546 |
| 2017 | $1,885 | $16,261 | $2,854 | $13,407 |
| 2016 | $1,715 | $14,651 | $2,854 | $11,797 |
| 2015 | $1,604 | $13,834 | $2,854 | $10,980 |
| 2013 | -- | $13,949 | $2,854 | $11,095 |
Source: Public Records
Map
Nearby Homes
- 10116 W 52nd Terrace
- 9719 W 53rd St
- 9929 W 52nd St
- Ashwood Plan at Bristol Highlands - North
- The Fleetwood Plan at Bristol Highlands - The Villas
- Cypress II Plan at Bristol Highlands - North
- The Fleetwood Plan at Bristol Highlands - The Manors
- The Brentwood Plan at Bristol Highlands - The Villas
- Yorkshire V Plan at Bristol Highlands - North
- The Kirkwood Plan at Bristol Highlands - The Villas
- 8013 Payne St
- The Rockwood Plan at Bristol Highlands - The Villas
- Magnolia Plan at Bristol Highlands - North
- 5220 Hayes St
- 5517 Hayes St
- 11002 W 55th Terrace
- 10511 W 49th Place
- 5003 Knox Ave
- 9328 W 51st St
- 0 W 49th St
- 10109 W 54th St
- 5332 Mastin St
- 5404 Mastin St
- 10113 W 54th St
- 5420 Mastin St
- 10108 W 54th St
- 10104 W 54th St
- 10112 W 54th St
- 10117 W 54th St
- 10100 W 54th St
- 10200 W 54th Terrace
- 10204 W 54th Terrace
- 5405 Mastin St
- 10201 W 54th St
- 5343 Mastin St
- 5328 Mastin St
- 5415 Mastin St
- 10201 W 54th Terrace
- 10200 W 54th St
- 5436 Mastin St