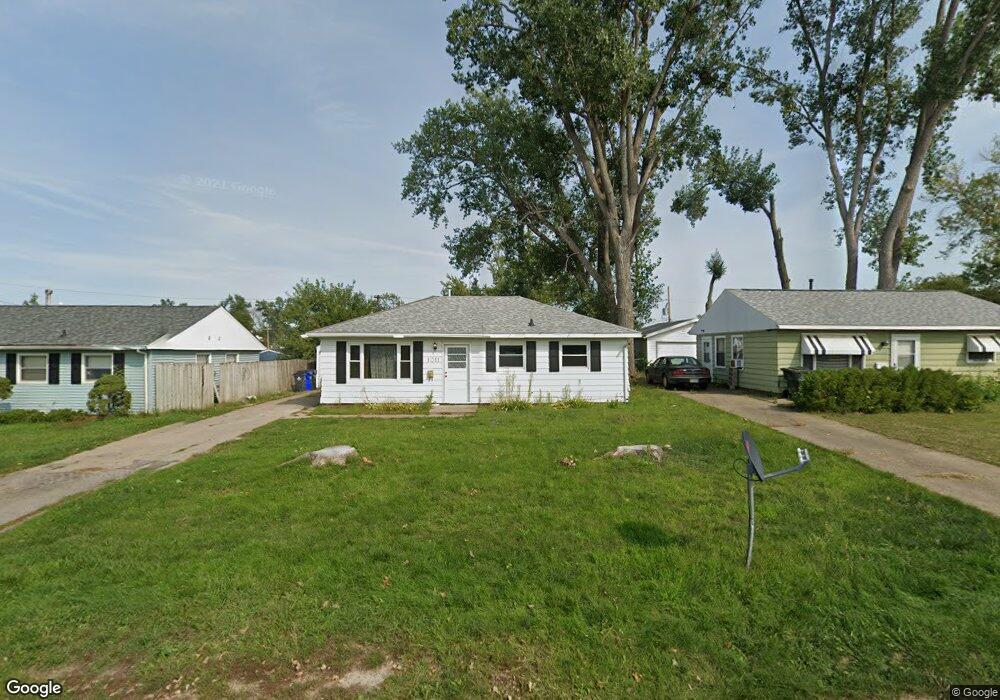
1011 18th St SW Cedar Rapids, IA 52404
Cleveland Area NeighborhoodEstimated Value: $132,616 - $156,000
3
Beds
1
Bath
864
Sq Ft
$165/Sq Ft
Est. Value
About This Home
This home is located at 1011 18th St SW, Cedar Rapids, IA 52404 and is currently estimated at $142,154, approximately $164 per square foot. 1011 18th St SW is a home located in Linn County with nearby schools including Junction City Elementary School, Cleveland Elementary School, and Kentucky Tech - Ashland Reg Tech Center.
Ownership History
Date
Name
Owned For
Owner Type
Purchase Details
Closed on
May 26, 2016
Sold by
Lkj Enterprises Llc
Bought by
Ask Inc
Current Estimated Value
Purchase Details
Closed on
Jan 4, 2010
Sold by
Covington James B
Bought by
The Lyle J Covington Family Trust
Purchase Details
Closed on
Jan 24, 2005
Sold by
Bushman Pamela A
Bought by
Covington Lyle J
Purchase Details
Closed on
Dec 30, 2004
Sold by
Covington Lyle J and Covington Evelyn I
Bought by
Steele Christopher P and Steele Catherine A
Purchase Details
Closed on
Nov 17, 1997
Sold by
Thompson Paul H and Thompson Linda S
Bought by
Bushman Pamela A
Home Financials for this Owner
Home Financials are based on the most recent Mortgage that was taken out on this home.
Original Mortgage
$53,000
Interest Rate
10%
Mortgage Type
Purchase Money Mortgage
Create a Home Valuation Report for This Property
The Home Valuation Report is an in-depth analysis detailing your home's value as well as a comparison with similar homes in the area
Home Values in the Area
Average Home Value in this Area
Purchase History
| Date | Buyer | Sale Price | Title Company |
|---|---|---|---|
| Ask Inc | -- | None Available | |
| The Lyle J Covington Family Trust | -- | None Available | |
| Covington Lyle J | $94,390 | -- | |
| Steele Christopher P | $79,950 | -- | |
| Bushman Pamela A | $52,500 | -- |
Source: Public Records
Mortgage History
| Date | Status | Borrower | Loan Amount |
|---|---|---|---|
| Previous Owner | Bushman Pamela A | $53,000 | |
| Closed | Steele Christopher P | $0 |
Source: Public Records
Tax History Compared to Growth
Tax History
| Year | Tax Paid | Tax Assessment Tax Assessment Total Assessment is a certain percentage of the fair market value that is determined by local assessors to be the total taxable value of land and additions on the property. | Land | Improvement |
|---|---|---|---|---|
| 2025 | $1,942 | $119,300 | $27,800 | $91,500 |
| 2024 | $323 | $111,600 | $25,200 | $86,400 |
| 2023 | $323 | $109,700 | $25,200 | $84,500 |
| 2022 | $1,812 | $91,600 | $21,500 | $70,100 |
| 2021 | $1,854 | $87,500 | $21,500 | $66,000 |
| 2020 | $1,854 | $84,000 | $20,200 | $63,800 |
| 2019 | $1,668 | $82,000 | $20,200 | $61,800 |
| 2018 | $1,622 | $77,400 | $20,200 | $57,200 |
| 2017 | $1,582 | $76,100 | $20,200 | $55,900 |
| 2016 | $1,582 | $74,400 | $20,200 | $54,200 |
| 2015 | $1,582 | $73,683 | $20,196 | $53,487 |
| 2014 | $1,615 | $75,935 | $20,196 | $55,739 |
| 2013 | $1,582 | $75,935 | $20,196 | $55,739 |
Source: Public Records
Map
Nearby Homes
- 1807 9th Ave SW
- 1206 18th St SW
- 1832 8th Ave SW
- 1253 20th St SW
- 1602 1st Ave NW
- 1400 7th Ave SW
- 1818 Holly Meadow Ave SW
- 1812 Holly Meadow Ave SW
- 1824 Holly Meadow Ave SW
- 1806 Holly Meadow Ave SW
- 2178 Chandler St SW
- 1913 Holly Meadow Ave SW
- 1801 Shady Grove Rd SW
- 235 Highland Dr NW
- 1960 Rockford Rd SW Unit 45
- 263 Highland Dr NW
- Remington - Cedar Rapids Plan at Whispering Pines
- Copeland Plan at Whispering Pines
- Meadowbrook - Cedar Rapids Plan at Stags Leap Estates
- Caldwell Plan at Stags Leap Estates
- 1015 18th St SW
- 1007 18th St SW
- 1019 18th St SW
- 1711 10th Ave SW
- 1003 18th St SW
- 1707 10th Ave SW
- 1006 17th St SW
- 1023 18th St SW
- 1014 17th St SW
- 1703 10th Ave SW
- 1027 18th St SW
- 1014 18th St SW
- 1010 18th St SW
- 1018 18th St SW
- 1006 18th St SW
- 1710 11th Ave SW
- 1022 18th St SW
- 1002 18th St SW
- 925 18th St SW
- 1714 11th Ave SW