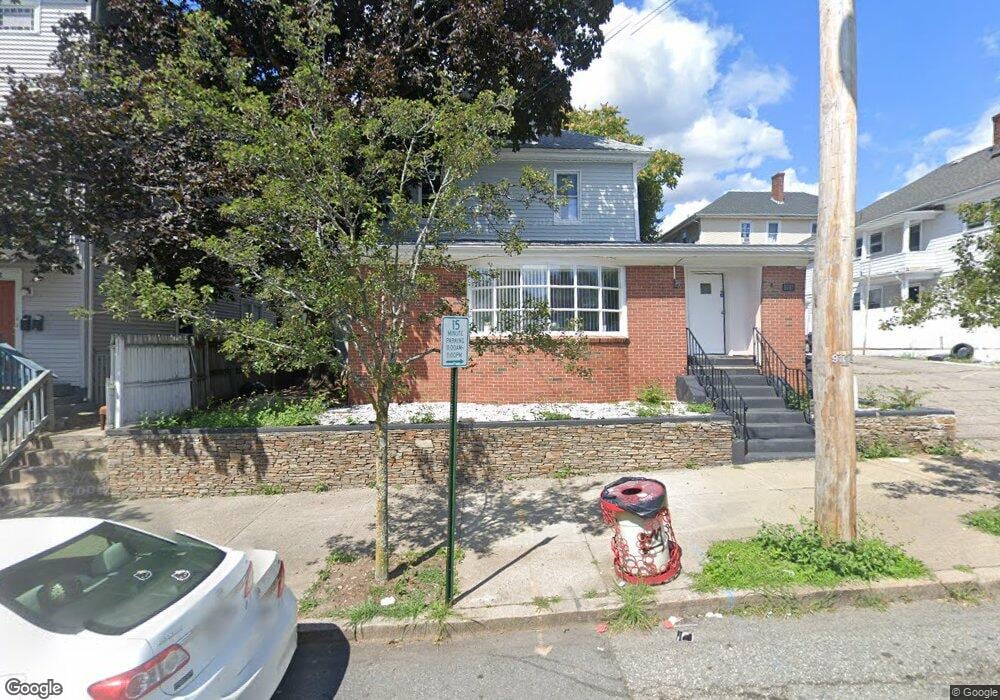
1011 Atwells Ave Providence, RI 02909
Mount Pleasant NeighborhoodEstimated Value: $628,751
6
Beds
4
Baths
4,104
Sq Ft
$153/Sq Ft
Est. Value
About This Home
This home is located at 1011 Atwells Ave, Providence, RI 02909 and is currently estimated at $628,751, approximately $153 per square foot. 1011 Atwells Ave is a home located in Providence County with nearby schools including Charles N. Fortes Elementary School, Asa Messer Elementary School, and Laurel Hill Annex School.
Ownership History
Date
Name
Owned For
Owner Type
Purchase Details
Closed on
Apr 5, 2022
Sold by
Your Choice Realty Llc
Bought by
Rosalino Sabrina C and Valenzuela Jovanny
Current Estimated Value
Home Financials for this Owner
Home Financials are based on the most recent Mortgage that was taken out on this home.
Original Mortgage
$432,030
Outstanding Balance
$402,791
Interest Rate
3.89%
Mortgage Type
FHA
Estimated Equity
$225,960
Purchase Details
Closed on
Jul 2, 2021
Sold by
Vidanchi Realty Llc
Bought by
Your Choice Realty Llc
Home Financials for this Owner
Home Financials are based on the most recent Mortgage that was taken out on this home.
Original Mortgage
$300,000
Interest Rate
2.9%
Mortgage Type
Purchase Money Mortgage
Purchase Details
Closed on
Oct 1, 2020
Sold by
Freedom Realty
Bought by
Vidanchi Realty Llc
Purchase Details
Closed on
Feb 3, 2017
Sold by
Rrfm Global Investment
Bought by
Freedom Realty Rigp
Purchase Details
Closed on
Aug 13, 2013
Sold by
Alcantara David
Bought by
Batista Ariel
Purchase Details
Closed on
Feb 23, 2009
Sold by
Fortune Assoc Llc
Bought by
Rfm Global Investment
Home Financials for this Owner
Home Financials are based on the most recent Mortgage that was taken out on this home.
Original Mortgage
$229,000
Interest Rate
5.06%
Mortgage Type
Commercial
Purchase Details
Closed on
Jun 17, 2008
Sold by
Fortune Assoc
Bought by
Torres Lisa
Purchase Details
Closed on
Sep 27, 2000
Sold by
Codori Donald F
Bought by
Pieranunzi Christopher
Create a Home Valuation Report for This Property
The Home Valuation Report is an in-depth analysis detailing your home's value as well as a comparison with similar homes in the area
Home Values in the Area
Average Home Value in this Area
Purchase History
| Date | Buyer | Sale Price | Title Company |
|---|---|---|---|
| Rosalino Sabrina C | $440,000 | None Available | |
| Rosalino Sabrina C | $440,000 | None Available | |
| Rosalino Sabrina C | $440,000 | None Available | |
| Your Choice Realty Llc | $238,000 | None Available | |
| Your Choice Realty Llc | $238,000 | None Available | |
| Your Choice Realty Llc | $238,000 | None Available | |
| Vidanchi Realty Llc | -- | None Available | |
| Vidanchi Realty Llc | -- | None Available | |
| Vidanchi Realty Llc | -- | None Available | |
| Freedom Realty Rigp | -- | -- | |
| Freedom Realty Rigp | -- | -- | |
| Batista Ariel | $169,000 | -- | |
| Batista Ariel | $169,000 | -- | |
| Rfm Global Investment | $229,000 | -- | |
| Rfm Global Investment | $229,000 | -- | |
| Torres Lisa | $239,900 | -- | |
| Torres Lisa | $239,900 | -- | |
| Pieranunzi Christopher | $90,000 | -- | |
| Pieranunzi Christopher | $90,000 | -- |
Source: Public Records
Mortgage History
| Date | Status | Borrower | Loan Amount |
|---|---|---|---|
| Open | Rosalino Sabrina C | $432,030 | |
| Closed | Rosalino Sabrina C | $432,030 | |
| Previous Owner | Your Choice Realty Llc | $300,000 | |
| Previous Owner | Pieranunzi Christopher | $229,000 |
Source: Public Records
Tax History Compared to Growth
Tax History
| Year | Tax Paid | Tax Assessment Tax Assessment Total Assessment is a certain percentage of the fair market value that is determined by local assessors to be the total taxable value of land and additions on the property. | Land | Improvement |
|---|---|---|---|---|
| 2025 | $8,213 | $562,500 | $158,100 | $404,400 |
| 2024 | -- | $352,800 | $95,800 | $257,000 |
| 2023 | $0 | $352,800 | $95,800 | $257,000 |
| 2022 | $0 | $352,800 | $95,800 | $257,000 |
| 2021 | $0 | $232,200 | $80,700 | $151,500 |
| 2020 | $0 | $232,200 | $80,700 | $151,500 |
| 2019 | $0 | $232,200 | $80,700 | $151,500 |
| 2018 | $0 | $208,800 | $80,700 | $128,100 |
| 2017 | $0 | $208,800 | $80,700 | $128,100 |
| 2016 | -- | $208,800 | $80,700 | $128,100 |
| 2015 | -- | $180,900 | $76,900 | $104,000 |
| 2014 | -- | $180,900 | $76,900 | $104,000 |
| 2013 | -- | $180,900 | $76,900 | $104,000 |
Source: Public Records
Map
Nearby Homes