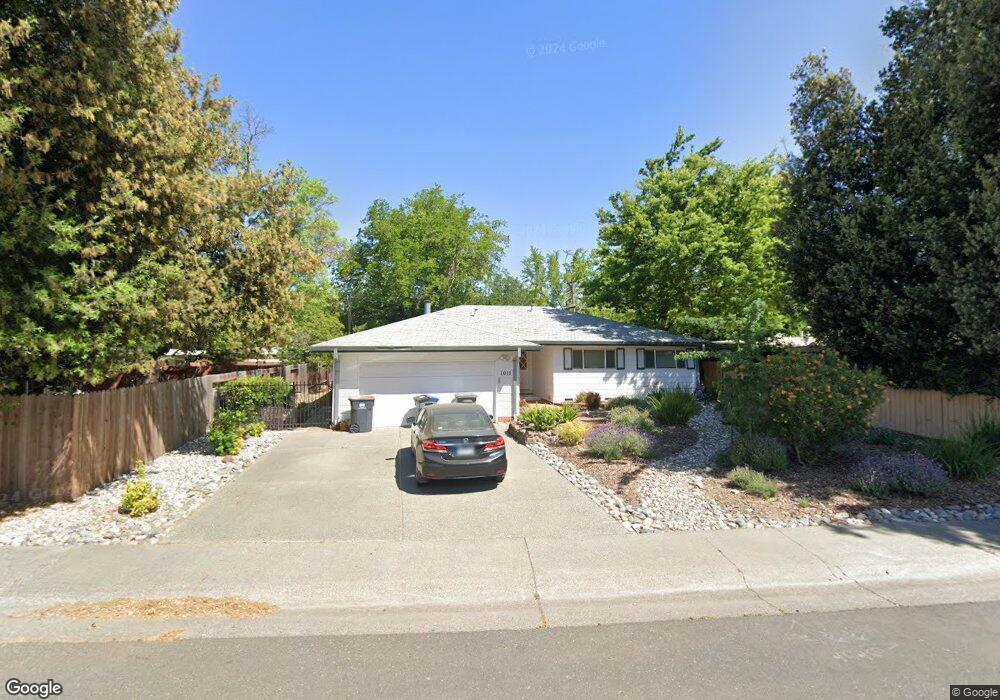
1011 E 8th St Davis, CA 95616
Central Davis NeighborhoodEstimated Value: $671,653 - $802,000
4
Beds
2
Baths
1,414
Sq Ft
$519/Sq Ft
Est. Value
About This Home
This home is located at 1011 E 8th St, Davis, CA 95616 and is currently estimated at $733,413, approximately $518 per square foot. 1011 E 8th St is a home located in Yolo County with nearby schools including North Davis Elementary School, Oliver Wendell Holmes Junior High School, and Davis Senior High School.
Ownership History
Date
Name
Owned For
Owner Type
Purchase Details
Closed on
Feb 22, 2022
Sold by
Elise Lamar Cindy
Bought by
Yang Tina Yu-Ting
Current Estimated Value
Home Financials for this Owner
Home Financials are based on the most recent Mortgage that was taken out on this home.
Original Mortgage
$342,000
Outstanding Balance
$295,381
Interest Rate
3.92%
Mortgage Type
New Conventional
Estimated Equity
$438,032
Purchase Details
Closed on
May 8, 2001
Sold by
Adams Marc and Adams Catalina
Bought by
Yang Ching Yu Hu and Yang Tina Yu Ting
Home Financials for this Owner
Home Financials are based on the most recent Mortgage that was taken out on this home.
Original Mortgage
$196,350
Interest Rate
7.62%
Purchase Details
Closed on
Aug 16, 1996
Sold by
Federal Home Loan Mortgage Corporation
Bought by
Adams Marc and Adams Catalina
Home Financials for this Owner
Home Financials are based on the most recent Mortgage that was taken out on this home.
Original Mortgage
$130,150
Interest Rate
8.23%
Create a Home Valuation Report for This Property
The Home Valuation Report is an in-depth analysis detailing your home's value as well as a comparison with similar homes in the area
Home Values in the Area
Average Home Value in this Area
Purchase History
| Date | Buyer | Sale Price | Title Company |
|---|---|---|---|
| Yang Tina Yu-Ting | -- | State Title | |
| Yang Ching Yu Hu | $280,500 | North American Title Co | |
| Adams Marc | $137,000 | North American Title Co |
Source: Public Records
Mortgage History
| Date | Status | Borrower | Loan Amount |
|---|---|---|---|
| Open | Yang Tina Yu-Ting | $342,000 | |
| Previous Owner | Yang Ching Yu Hu | $196,350 | |
| Previous Owner | Adams Marc | $130,150 |
Source: Public Records
Tax History
| Year | Tax Paid | Tax Assessment Tax Assessment Total Assessment is a certain percentage of the fair market value that is determined by local assessors to be the total taxable value of land and additions on the property. | Land | Improvement |
|---|---|---|---|---|
| 2025 | $6,015 | $422,644 | $113,000 | $309,644 |
| 2023 | $6,015 | $406,234 | $108,613 | $297,621 |
| 2022 | $5,757 | $398,270 | $106,484 | $291,786 |
| 2021 | $5,614 | $390,462 | $104,397 | $286,065 |
| 2020 | $5,522 | $386,459 | $103,327 | $283,132 |
| 2019 | $5,230 | $378,882 | $101,301 | $277,581 |
| 2018 | $4,881 | $371,454 | $99,315 | $272,139 |
| 2017 | $4,777 | $364,171 | $97,368 | $266,803 |
| 2016 | $4,614 | $357,031 | $95,459 | $261,572 |
| 2015 | $4,457 | $351,669 | $94,026 | $257,643 |
| 2014 | $4,457 | $344,782 | $92,185 | $252,597 |
Source: Public Records
Map
Nearby Homes
- 601 J St
- 646 F St
- 739 M St
- 615 11th St
- 704 6th St
- 425 J St
- 1306 Drexel Dr
- 717 D St
- 405 7th St
- 1224 Spruce Ln
- 1018 Ovejas Ave
- 1009 Ovejas Ave Unit 11
- 1411 Madrone Ln
- 337 B St
- 2011 Regis Dr
- 1000 Berryessa Ln Unit 333
- 1000 Berryessa Ln Unit 232
- 1000 Berryessa Ln Unit 314
- 1000 Berryessa Ln Unit 211
- 53 College Park
Your Personal Tour Guide
Ask me questions while you tour the home.