
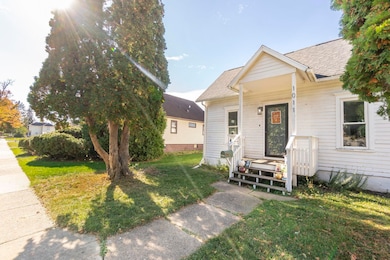
1011 Grove St Cedar Falls, IA 50613
Estimated payment $894/month
Highlights
- 1 Car Detached Garage
- Laundry Room
- Wood Siding
- Holmes Junior High School Rated A-
- Central Air
About This Home
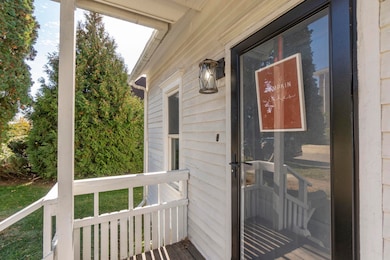
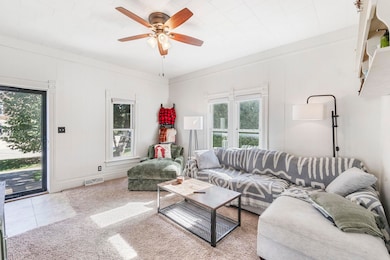
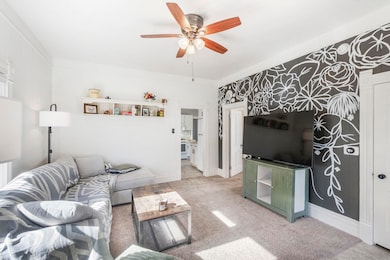
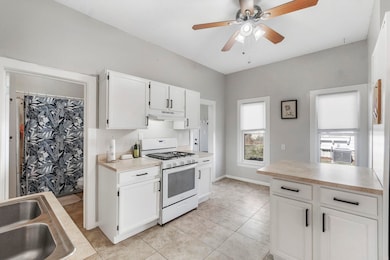
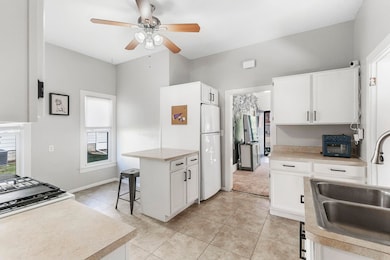
This charming home is conveniently located near parks, trails, and downtown Cedar Falls. The cheery front porch welcomes you into the generous living area. Just off the living room, you'll find a bedroom that's perfectly sized and could also make a wonderful bonus room or office space. The home's white kitchen feels fresh and clean and has a breakfast bar that provides eat-in seating. Beyond the kitchen, you'll love the gigantic master bedroom, which has enough room to hold a second seating area, workout equipment, or an office. The main floor also features a full bathroom and a sizeable laundry room/drop zone. The peaceful backyard is fully fenced for privacy and boasts garden beds and wildflower beds. You'll also love the lavender in the front yard! Don't miss out on this affordable Cedar Falls option! It's move-in ready and waiting for its perfect next owner!
Home Details
Home Type
- Single Family
Est. Annual Taxes
- $1,868
Year Built
- Built in 1894
Lot Details
- 8,712 Sq Ft Lot
- Lot Dimensions are 66x132
- Property is zoned CDDT
Parking
- 1 Car Detached Garage
Home Design
- 944 Sq Ft Home
- Asphalt Roof
- Wood Siding
Bedrooms and Bathrooms
- 2 Bedrooms
- 1 Full Bathroom
Laundry
- Laundry Room
- Laundry on main level
Schools
- Lincoln Elementary Waterloo
- Holmes Junior High
- Cedar Falls High School
Utilities
- Central Air
Additional Features
- Partially Finished Basement
Listing and Financial Details
- Assessor Parcel Number 891412457004
Map
Home Values in the Area
Average Home Value in this Area
Tax History
| Year | Tax Paid | Tax Assessment Tax Assessment Total Assessment is a certain percentage of the fair market value that is determined by local assessors to be the total taxable value of land and additions on the property. | Land | Improvement |
|---|---|---|---|---|
| 2025 | $1,868 | $132,290 | $48,510 | $83,780 |
| 2024 | $1,868 | $116,120 | $32,340 | $83,780 |
| 2023 | $1,800 | $116,120 | $32,340 | $83,780 |
| 2022 | $1,738 | $97,520 | $32,340 | $65,180 |
| 2021 | $1,330 | $93,000 | $32,340 | $60,660 |
| 2020 | $1,300 | $80,060 | $19,400 | $60,660 |
| 2019 | $1,300 | $80,060 | $19,400 | $60,660 |
| 2018 | $1,318 | $80,060 | $19,400 | $60,660 |
| 2017 | $1,350 | $80,060 | $19,400 | $60,660 |
| 2016 | $1,260 | $80,060 | $19,400 | $60,660 |
| 2015 | $1,260 | $80,060 | $19,400 | $60,660 |
| 2014 | $1,226 | $77,300 | $19,400 | $57,900 |
Property History
| Date | Event | Price | List to Sale | Price per Sq Ft |
|---|---|---|---|---|
| 11/09/2025 11/09/25 | Pending | -- | -- | -- |
| 11/04/2025 11/04/25 | For Sale | $140,000 | 0.0% | $148 / Sq Ft |
| 10/29/2025 10/29/25 | Pending | -- | -- | -- |
| 10/28/2025 10/28/25 | For Sale | $140,000 | -- | $148 / Sq Ft |
Purchase History
| Date | Type | Sale Price | Title Company |
|---|---|---|---|
| Warranty Deed | $117,000 | Title Services Corporation | |
| Warranty Deed | $119,000 | None Available | |
| Warranty Deed | $97,000 | None Available |
Mortgage History
| Date | Status | Loan Amount | Loan Type |
|---|---|---|---|
| Open | $113,490 | New Conventional | |
| Previous Owner | $95,243 | FHA |
Source: Northeast Iowa Regional Board of REALTORS®
MLS Number: NBR20255309
APN: 8914-12-457-004
Disclaimer: Certain information contained herein is derived from information provided by parties other than Homes.com. All information provided is deemed reliable, but is not guaranteed to be accurate and should be independently verified.
![]() IDX information is provided exclusively for personal, non-commercial use, and may not be used for any purpose other than to identify prospective properties consumers may be interested in purchasing. Information is deemed reliable but not guaranteed.
IDX information is provided exclusively for personal, non-commercial use, and may not be used for any purpose other than to identify prospective properties consumers may be interested in purchasing. Information is deemed reliable but not guaranteed.
