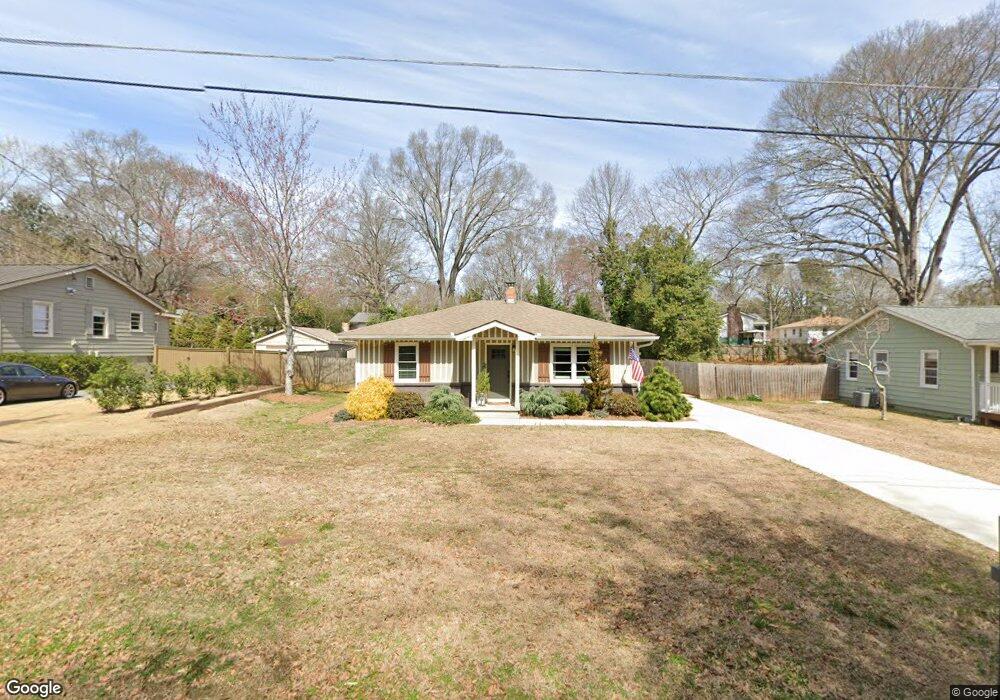
1011 Magbee Dr SE Smyrna, GA 30080
Estimated Value: $359,000 - $479,000
3
Beds
2
Baths
964
Sq Ft
$436/Sq Ft
Est. Value
About This Home
This home is located at 1011 Magbee Dr SE, Smyrna, GA 30080 and is currently estimated at $420,018, approximately $435 per square foot. 1011 Magbee Dr SE is a home located in Cobb County with nearby schools including Smyrna Elementary School, Campbell Middle School, and Campbell High School.
Ownership History
Date
Name
Owned For
Owner Type
Purchase Details
Closed on
Jun 8, 2012
Sold by
Ridgecrest Ventures Inc
Bought by
Wise Michael
Current Estimated Value
Home Financials for this Owner
Home Financials are based on the most recent Mortgage that was taken out on this home.
Original Mortgage
$142,975
Outstanding Balance
$98,874
Interest Rate
3.86%
Mortgage Type
New Conventional
Estimated Equity
$321,144
Purchase Details
Closed on
May 31, 2011
Sold by
Robert Kennedy Llc
Bought by
Ridgecrest Ventures Inc
Purchase Details
Closed on
May 23, 2011
Sold by
Peoples Financial Corp
Bought by
Obryant M Jerry
Purchase Details
Closed on
Jan 25, 2008
Sold by
Obryant M Jerry
Bought by
Coggins Otis F
Home Financials for this Owner
Home Financials are based on the most recent Mortgage that was taken out on this home.
Original Mortgage
$142,070
Interest Rate
6.17%
Mortgage Type
FHA
Purchase Details
Closed on
Nov 3, 1993
Sold by
Howard Billy G Robyn D
Bought by
Obryant M Jerry Shelia A
Create a Home Valuation Report for This Property
The Home Valuation Report is an in-depth analysis detailing your home's value as well as a comparison with similar homes in the area
Home Values in the Area
Average Home Value in this Area
Purchase History
| Date | Buyer | Sale Price | Title Company |
|---|---|---|---|
| Wise Michael | $150,500 | -- | |
| Ridgecrest Ventures Inc | $52,000 | -- | |
| Robert Kennedy Llc | $30,000 | -- | |
| Obryant M Jerry | -- | -- | |
| Coggins Otis F | $144,300 | -- | |
| Obryant M Jerry Shelia A | $55,000 | -- |
Source: Public Records
Mortgage History
| Date | Status | Borrower | Loan Amount |
|---|---|---|---|
| Open | Wise Michael | $142,975 | |
| Previous Owner | Coggins Otis F | $142,070 | |
| Closed | Obryant M Jerry Shelia A | -- |
Source: Public Records
Tax History Compared to Growth
Tax History
| Year | Tax Paid | Tax Assessment Tax Assessment Total Assessment is a certain percentage of the fair market value that is determined by local assessors to be the total taxable value of land and additions on the property. | Land | Improvement |
|---|---|---|---|---|
| 2025 | $2,595 | $143,904 | $50,000 | $93,904 |
| 2024 | $2,759 | $152,652 | $60,000 | $92,652 |
| 2023 | $2,564 | $165,136 | $40,000 | $125,136 |
| 2022 | $2,494 | $137,116 | $32,000 | $105,116 |
| 2021 | $2,114 | $116,204 | $32,000 | $84,204 |
| 2020 | $1,924 | $106,244 | $24,000 | $82,244 |
| 2019 | $1,842 | $101,948 | $20,000 | $81,948 |
| 2018 | $1,657 | $92,192 | $20,000 | $72,192 |
| 2017 | $1,447 | $82,160 | $18,000 | $64,160 |
| 2016 | $1,112 | $64,260 | $18,000 | $46,260 |
| 2015 | $1,127 | $64,260 | $18,000 | $46,260 |
| 2014 | $847 | $49,536 | $0 | $0 |
Source: Public Records
Map
Nearby Homes
- 1019 Magbee Dr SE
- 1042 Oakdale Dr SE
- 982 Oakdale Dr SE
- 3543 S Cobb Dr SE
- 1044 Pinedale Dr SE
- 1024 Magnolia Dr SE
- 1060 Pinedale Dr SE
- 1005 Pinedale Dr SE
- 3568 Lake Dr SE
- 984 Valley Dr SE
- 116 Festoon Ct
- 3654 Lake Dr SE
- 305 Berkeley Ct SE
- 1261 Cliffwood Dr SE
- 3215 Concord Cir SE
- 3364 Dunn St SE
- 3538 S Sherwood Rd SE Unit 5
- 4222 Terrace Ct SE
- 1241 Kingsview Dr SE
- 0 Magbee Dr
- 1001 Magbee Dr SE
- 1025 Magbee Dr SE
- 1018 Magbee Dr SE
- 1016 Oakdale Dr SE
- 1024 Oakdale Dr SE
- 1008 Oakdale Dr SE
- 997 Magbee Dr SE
- 1026 Magbee Dr SE
- 1033 Magbee Dr SE
- 3499 S Cobb Dr SE
- 1000R Oakdale Dr SE
- 1000 Oakdale Dr SE
- 1034 Oakdale Dr SE
- 1034 Magbee Dr SE
- 990 Oakdale Dr SE
- 1041 Magbee Dr SE
- 1042 Magbee Dr SE
- 1011 Oakdale Dr SE
- 1019 Oakdale Dr SE