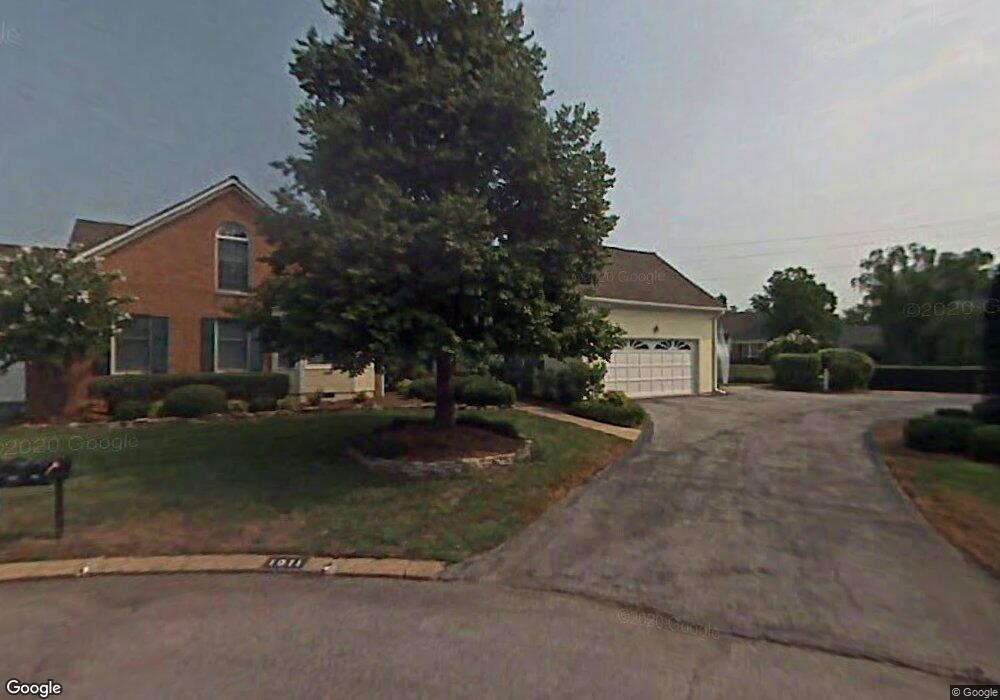
1011 Northbridge Ln Unit 26J Chattanooga, TN 37405
Northshore NeighborhoodEstimated Value: $698,735 - $853,000
3
Beds
2
Baths
2,350
Sq Ft
$322/Sq Ft
Est. Value
About This Home
This home is located at 1011 Northbridge Ln Unit 26J, Chattanooga, TN 37405 and is currently estimated at $756,184, approximately $321 per square foot. 1011 Northbridge Ln Unit 26J is a home located in Hamilton County with nearby schools including Normal Park Museum Magnet School, Red Bank High School, and The Bright School.
Ownership History
Date
Name
Owned For
Owner Type
Purchase Details
Closed on
Jan 21, 2016
Sold by
Black Joy D
Bought by
Black Joy Diane and Joy Diane Black Revocable Trust
Current Estimated Value
Purchase Details
Closed on
Jan 28, 2010
Sold by
Comer Charles A
Bought by
Black Joy D
Home Financials for this Owner
Home Financials are based on the most recent Mortgage that was taken out on this home.
Original Mortgage
$261,675
Interest Rate
4.82%
Mortgage Type
New Conventional
Purchase Details
Closed on
Jun 19, 2007
Sold by
Comer Charles A and Comer Margaret P
Bought by
Comer Charles A and Charles A Comer Revocable Trust
Purchase Details
Closed on
Jun 8, 1998
Sold by
Morton Tom L and Morton Sue R
Bought by
Comer Charles A and Comer Margaret P
Purchase Details
Closed on
Oct 1, 1997
Sold by
Ahern Doris A
Bought by
Morton Tom L and Morton Sue R
Create a Home Valuation Report for This Property
The Home Valuation Report is an in-depth analysis detailing your home's value as well as a comparison with similar homes in the area
Home Values in the Area
Average Home Value in this Area
Purchase History
| Date | Buyer | Sale Price | Title Company |
|---|---|---|---|
| Black Joy Diane | -- | None Available | |
| Black Joy D | $320,000 | Milligan Reynolds Guaranty T | |
| Comer Charles A | -- | None Available | |
| Comer Charles A | $271,500 | -- | |
| Morton Tom L | $259,000 | -- |
Source: Public Records
Mortgage History
| Date | Status | Borrower | Loan Amount |
|---|---|---|---|
| Previous Owner | Black Joy D | $261,675 |
Source: Public Records
Tax History Compared to Growth
Tax History
| Year | Tax Paid | Tax Assessment Tax Assessment Total Assessment is a certain percentage of the fair market value that is determined by local assessors to be the total taxable value of land and additions on the property. | Land | Improvement |
|---|---|---|---|---|
| 2024 | $2,457 | $109,800 | $0 | $0 |
| 2023 | $2,457 | $109,800 | $0 | $0 |
| 2022 | $2,457 | $109,800 | $0 | $0 |
| 2021 | $2,457 | $109,800 | $0 | $0 |
| 2020 | $2,598 | $93,950 | $0 | $0 |
| 2019 | $2,598 | $93,950 | $0 | $0 |
| 2018 | $2,139 | $93,950 | $0 | $0 |
| 2017 | $2,598 | $93,950 | $0 | $0 |
| 2016 | $2,590 | $0 | $0 | $0 |
| 2015 | $4,753 | $0 | $0 | $0 |
| 2014 | $4,753 | $0 | $0 | $0 |
Source: Public Records
Map
Nearby Homes
- 1002 Northbridge Ln
- 1414 Heritage Landing Dr Unit 33R1
- 1220 Bridgewater Ln Unit 59E4
- 1426 Heritage Landing Dr Unit 34D2
- 1134 Constitution Dr
- 1298 Heritage Landing Dr
- 1296 Heritage Landing Dr Unit 60B2
- 1524 Heritage Landing Dr Unit 20Q2
- 1516 Heritage Landing Dr
- 1012 Ariel Ln
- 1118 Constitution Dr
- 1705 Carroll Ln
- 1083 Constitution Dr
- 1103 Centennial Dr
- 1511 Carroll Ln
- 800 Barton Ave
- 703 Barton Ave
- 1315 Dugdale St
- 232 Jarnigan Ave
- 218 Baker St
- 1010 Northbridge Ln
- 1007 Northbridge Ln Unit 25
- 1006 Northbridge Ln
- 1005 Northbridge Ln Unit 25NI
- 1412 Heritage Landing Dr Unit 33R2
- 1412 Heritage Landing Dr Unit 33
- 1004 Northbridge Ln
- 1004 Northbridge Ln Unit C068
- 1416 Heritage Landing Dr Unit 33Y
- 1410 Heritage Landing Dr
- 1410 Heritage Landing Dr Unit 33
- 1002 Northbridge Ln Unit 27
- 1003 Northbridge Ln 25-N2
- 1003 Northbridge Ln Unit 25N2
- 1003 Northbridge Ln Unit 25
- 1402 Heritage Landing Dr
- 1400 Heritage Landing Dr
- 1400 Heritage Landing Dr Unit 32
- 1420 Heritage Landing Dr
- 1420 Heritage Landing Dr Unit 34