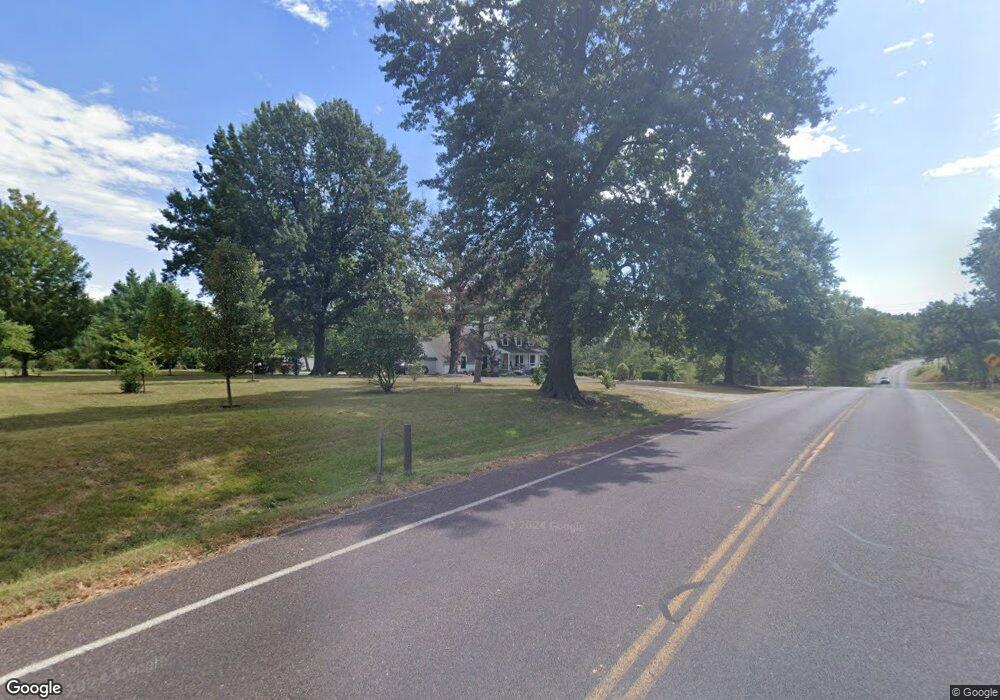
10111 Milton Thompson Rd Lees Summit, MO 64086
Estimated Value: $403,000 - $633,000
3
Beds
3
Baths
2,112
Sq Ft
$270/Sq Ft
Est. Value
About This Home
This home is located at 10111 Milton Thompson Rd, Lees Summit, MO 64086 and is currently estimated at $571,159, approximately $270 per square foot. 10111 Milton Thompson Rd is a home located in Jackson County with nearby schools including Mason Elementary School, Bernard C. Campbell Middle School, and Lee's Summit North High School.
Ownership History
Date
Name
Owned For
Owner Type
Purchase Details
Closed on
Oct 6, 2020
Sold by
Reichert Eric R and Reichert Amanda
Bought by
Hatfield Shane M and Hatfield Laura E
Current Estimated Value
Purchase Details
Closed on
Jun 7, 2010
Sold by
Mickelsen Erik and Mickelsen Kerri
Bought by
Reichert Eric R
Home Financials for this Owner
Home Financials are based on the most recent Mortgage that was taken out on this home.
Original Mortgage
$180,000
Interest Rate
4.87%
Mortgage Type
Credit Line Revolving
Purchase Details
Closed on
May 29, 2002
Sold by
Cantrell Ralph Sterling and Cantrell Wanda Jean
Bought by
Wehmeir Keith W and Wehmeir Janet R
Home Financials for this Owner
Home Financials are based on the most recent Mortgage that was taken out on this home.
Original Mortgage
$340,000
Interest Rate
6.92%
Mortgage Type
Purchase Money Mortgage
Create a Home Valuation Report for This Property
The Home Valuation Report is an in-depth analysis detailing your home's value as well as a comparison with similar homes in the area
Purchase History
| Date | Buyer | Sale Price | Title Company |
|---|---|---|---|
| Hatfield Shane M | -- | Continental Title Co | |
| Reichert Eric R | -- | Assured Quality Title Co | |
| Wehmeir Keith W | -- | -- |
Source: Public Records
Mortgage History
| Date | Status | Borrower | Loan Amount |
|---|---|---|---|
| Previous Owner | Reichert Eric R | $180,000 | |
| Previous Owner | Wehmeir Keith W | $340,000 |
Source: Public Records
Tax History
| Year | Tax Paid | Tax Assessment Tax Assessment Total Assessment is a certain percentage of the fair market value that is determined by local assessors to be the total taxable value of land and additions on the property. | Land | Improvement |
|---|---|---|---|---|
| 2025 | $6,568 | $54,276 | $16,141 | $38,135 |
| 2024 | $6,568 | $94,212 | $28,692 | $65,520 |
| 2023 | $6,501 | $94,211 | $30,848 | $63,363 |
| 2022 | $3,219 | $41,040 | $8,237 | $32,803 |
| 2021 | $3,078 | $41,040 | $8,237 | $32,803 |
| 2020 | $2,800 | $35,947 | $8,237 | $27,710 |
| 2019 | $2,737 | $35,947 | $8,237 | $27,710 |
| 2018 | $2,508 | $30,597 | $5,668 | $24,929 |
| 2017 | $2,468 | $30,597 | $5,668 | $24,929 |
| 2016 | $2,468 | $29,830 | $8,882 | $20,948 |
| 2014 | $2,523 | $29,830 | $8,882 | $20,948 |
Source: Public Records
Map
Nearby Homes
- 26104 E 99th St
- 0000 S St
- 8 U St
- 19 U St
- 41 I St
- 10304 Howard Rd
- 25408 NE Colbern Rd
- 1058 SW Conch Way
- 1121 SW Brookside Ct
- 25404 Lawnwood Ct
- 1108 SW Whispering Willow Way
- 27315 E Acacia Dr
- 27309 Acacia Dr
- 27311 Acacia Dr
- 27307 Acacia Dr
- 27319 E Acacia Dr
- 27305 Acacia Dr
- 27313 E Acacia Dr
- 27317 E Acacia Dr
- 375 SW Amara Dr
- 10111 Milton Thompson Rd
- 10114 Milton Thompson Rd
- 10105 Milton Thompson Rd
- 10126 Milton Thompson Rd
- 10106 Milton Thompson Rd
- 23 S Lake Shore Dr
- 10217 Milton Thompson Rd
- 10210 Milton Thompson Rd
- 10100 Milton Thompson Rd
- 12 S Lake Shore Dr
- 22 S Lake Shore Dr
- 10 S Lake Shore Dr
- 104 Lake Shore Dr
- 21 S Lake Shore Dr Unit S
- 21 S Lake Shore Dr
- 26300 Milton Thompson Rd
- 109 T St
- 109 T St
- 26200 Milton Thompson Rd
- 111 T St
Your Personal Tour Guide
Ask me questions while you tour the home.