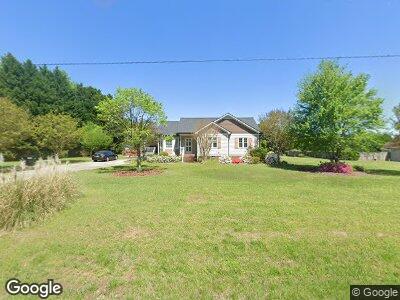
1012 Pagan Rd Raleigh, NC 27603
Estimated Value: $313,000 - $340,000
3
Beds
2
Baths
1,231
Sq Ft
$267/Sq Ft
Est. Value
About This Home
This home is located at 1012 Pagan Rd, Raleigh, NC 27603 and is currently estimated at $328,190, approximately $266 per square foot. 1012 Pagan Rd is a home located in Wake County with nearby schools including Rand Road Elementary, North Garner Middle, and South Garner High.
Ownership History
Date
Name
Owned For
Owner Type
Purchase Details
Closed on
May 30, 2003
Sold by
Jensen John D and Jensen Jessica Ware
Bought by
Holder Brian Scott and Holder Jennifer Lee
Current Estimated Value
Home Financials for this Owner
Home Financials are based on the most recent Mortgage that was taken out on this home.
Original Mortgage
$122,573
Outstanding Balance
$56,885
Interest Rate
5.79%
Mortgage Type
FHA
Estimated Equity
$259,506
Purchase Details
Closed on
Aug 24, 1999
Sold by
Federal National Mortgage Association
Bought by
Jensen John D and Ware Jessica F
Home Financials for this Owner
Home Financials are based on the most recent Mortgage that was taken out on this home.
Original Mortgage
$98,880
Interest Rate
7.58%
Purchase Details
Closed on
Mar 16, 1999
Sold by
David Cecilia J and David Daniel T
Bought by
Federal National Mortgage Association
Create a Home Valuation Report for This Property
The Home Valuation Report is an in-depth analysis detailing your home's value as well as a comparison with similar homes in the area
Home Values in the Area
Average Home Value in this Area
Purchase History
| Date | Buyer | Sale Price | Title Company |
|---|---|---|---|
| Holder Brian Scott | $124,000 | -- | |
| Jensen John D | -- | -- | |
| Federal National Mortgage Association | $93,796 | -- |
Source: Public Records
Mortgage History
| Date | Status | Borrower | Loan Amount |
|---|---|---|---|
| Closed | Holder Brian Scott | $6,887 | |
| Open | Holder Brian Scott | $122,573 | |
| Previous Owner | Jensen John D | $17,500 | |
| Previous Owner | Jensen John D | $100,000 | |
| Previous Owner | Jensen John D | $98,880 |
Source: Public Records
Tax History Compared to Growth
Tax History
| Year | Tax Paid | Tax Assessment Tax Assessment Total Assessment is a certain percentage of the fair market value that is determined by local assessors to be the total taxable value of land and additions on the property. | Land | Improvement |
|---|---|---|---|---|
| 2024 | $1,856 | $295,626 | $100,000 | $195,626 |
| 2023 | $1,481 | $187,333 | $48,000 | $139,333 |
| 2022 | $1,373 | $187,333 | $48,000 | $139,333 |
| 2021 | $1,336 | $187,333 | $48,000 | $139,333 |
| 2020 | $1,314 | $187,333 | $48,000 | $139,333 |
| 2019 | $1,232 | $148,343 | $45,000 | $103,343 |
| 2018 | $1,133 | $148,343 | $45,000 | $103,343 |
| 2017 | $1,075 | $148,343 | $45,000 | $103,343 |
| 2016 | $1,053 | $148,343 | $45,000 | $103,343 |
| 2015 | $1,000 | $141,055 | $40,000 | $101,055 |
| 2014 | $948 | $141,055 | $40,000 | $101,055 |
Source: Public Records
Map
Nearby Homes
- 9912 Sauls Rd
- 1513 Hoke Landing Ln
- 6301 Cayuse Ln
- 6245 Hampton Ridge Rd
- 1501 Ramson Ct
- 1012 Mountain Laurel Dr
- 6512 Southern Times Dr
- 1408 Harvey Johnson Rd
- 1421 Harvey Johnson Rd
- 432 Kings Hollow Dr
- 6765 Rock Service Station Rd
- 1101 Sky Wave Trail
- 6513 Cablewood Dr
- 6521 Cablewood Dr
- 1017 Azalea Garden Cir
- 1000 Azalea Garden Cir
- 1021 Azalea Garden Cir
- 1029 Azalea Garden Cir
- 1020 Retriever Ln
- 8733 Crowder Rd
- 1012 Pagan Rd
- 1020 Pagan Rd
- 9620 Sauls Rd
- 1004 Pagan Rd
- 5900 Swales Way
- 0 Sauls Rd Unit 1909389
- 9832 Sauls Rd
- 9836 Sauls Rd
- 9920 Sauls Rd
- 0 Sauls Rd Unit 2 TR1909389
- 0 Sauls Rd Unit 2398071
- 00 Sauls Rd
- 0 Sauls Rd Unit 2
- 1024 Pagan Rd
- 1001 Bellewood Farms Rd
- 5904 Swales Way
- 5901 Swales Way
- 1025 Pagan Rd
- 9605 Sauls Rd
- 9605 Sauls Rd