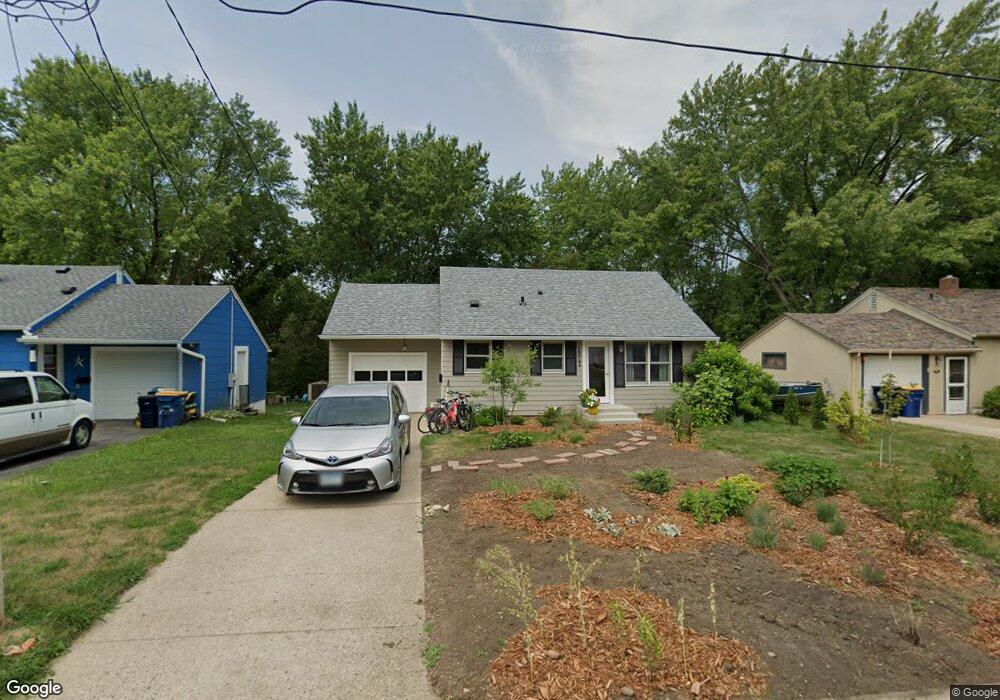
1012 Spring St S Northfield, MN 55057
Estimated Value: $262,000 - $304,874
2
Beds
1
Bath
1,148
Sq Ft
$249/Sq Ft
Est. Value
About This Home
This home is located at 1012 Spring St S, Northfield, MN 55057 and is currently estimated at $286,219, approximately $249 per square foot. 1012 Spring St S is a home located in Rice County with nearby schools including Spring Creek Elementary, Northfield Middle School, and Northfield Senior High School.
Ownership History
Date
Name
Owned For
Owner Type
Purchase Details
Closed on
Dec 27, 2021
Sold by
Rossow Chad J
Bought by
Tekla A Johnson Trusts
Current Estimated Value
Home Financials for this Owner
Home Financials are based on the most recent Mortgage that was taken out on this home.
Original Mortgage
$122,000
Outstanding Balance
$112,453
Interest Rate
3.12%
Mortgage Type
New Conventional
Estimated Equity
$173,766
Purchase Details
Closed on
Oct 21, 1999
Sold by
Sexton Kerry L and Sexton Pamela J
Bought by
Rossow Chad J and Beumer Julie K
Create a Home Valuation Report for This Property
The Home Valuation Report is an in-depth analysis detailing your home's value as well as a comparison with similar homes in the area
Home Values in the Area
Average Home Value in this Area
Purchase History
| Date | Buyer | Sale Price | Title Company |
|---|---|---|---|
| Tekla A Johnson Trusts | $272,000 | None Available | |
| Rossow Chad J | $107,000 | -- |
Source: Public Records
Mortgage History
| Date | Status | Borrower | Loan Amount |
|---|---|---|---|
| Open | Tekla A Johnson Trusts | $122,000 |
Source: Public Records
Tax History Compared to Growth
Tax History
| Year | Tax Paid | Tax Assessment Tax Assessment Total Assessment is a certain percentage of the fair market value that is determined by local assessors to be the total taxable value of land and additions on the property. | Land | Improvement |
|---|---|---|---|---|
| 2025 | $3,424 | $232,600 | $57,200 | $175,400 |
| 2024 | $3,424 | $213,700 | $52,900 | $160,800 |
| 2023 | $2,976 | $213,700 | $52,900 | $160,800 |
| 2022 | $2,590 | $198,000 | $51,500 | $146,500 |
| 2021 | $2,404 | $170,800 | $44,300 | $126,500 |
| 2020 | $2,274 | $158,100 | $41,500 | $116,600 |
| 2019 | $2,146 | $148,000 | $40,000 | $108,000 |
| 2018 | $1,944 | $139,200 | $40,000 | $99,200 |
| 2017 | $1,620 | $126,400 | $32,900 | $93,500 |
| 2016 | $1,660 | $117,400 | $32,900 | $84,500 |
| 2015 | $1,798 | $114,800 | $32,900 | $81,900 |
| 2014 | -- | $114,800 | $32,900 | $81,900 |
Source: Public Records
Map
Nearby Homes
- 1011 Poplar St
- 917 Division St S
- 1409 Washington St
- 1015 College St
- 1603 Washington St
- 308 7th St E
- 405 8th St E
- 1710 Harrison Ct
- XXXX Harvest Hills Outlook
- 411 Washington St
- 1707 Jackson Ct
- 408 5th St E
- 506 506 E 6th St
- 1819 Truman Ct
- TBB 403 (To Be Built College St
- 701 3rd St W
- 1113 Elm St
- XXXX Division St S
- 1741 Roosevelt Dr
- 504 2nd St W
- 1010 Spring St S
- 1014 Spring St S
- 1014 1014 Spring-Street-s
- 1008 Spring St S
- 1104 Spring St S
- 1101 Linden St S
- 1105 Linden St S
- 1006 Spring St S
- 1019 Linden St S
- 1109 Linden St S
- 1015 Linden St S
- 1108 Spring St S
- 1004 Spring St S
- 1101 Spring St S
- 1013 Spring St S
- 1103 Spring St S
- 1011 Spring St S
- 1011 Linden St S
- 1113 Linden St S
- 1107 Spring St S