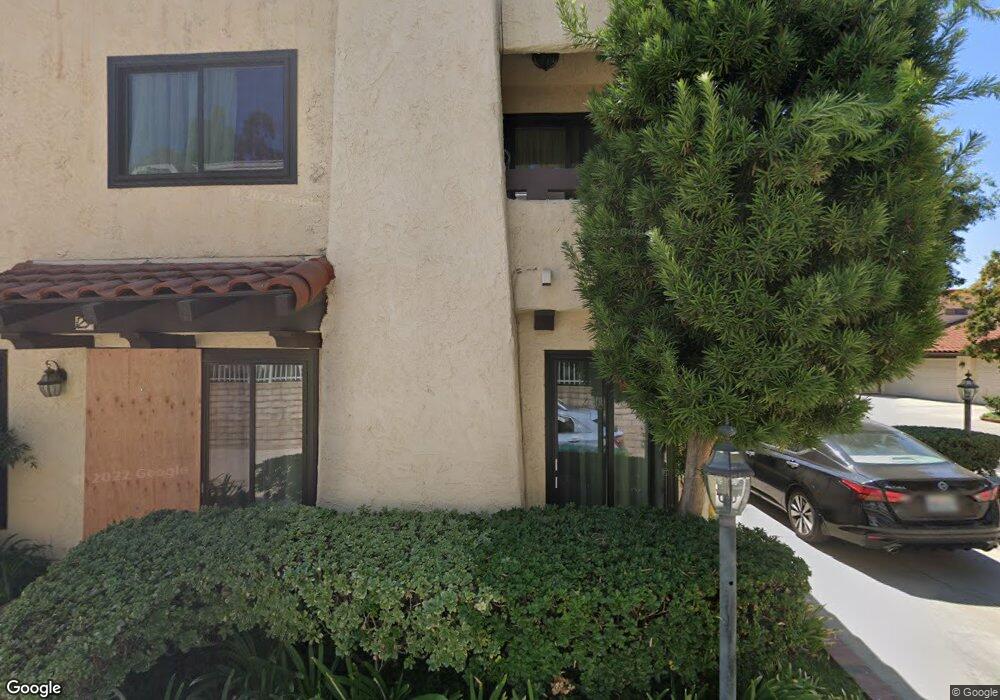
10126 Reseda Blvd Unit 123 Northridge, CA 91324
Estimated Value: $662,268 - $709,000
3
Beds
3
Baths
1,575
Sq Ft
$433/Sq Ft
Est. Value
About This Home
This home is located at 10126 Reseda Blvd Unit 123, Northridge, CA 91324 and is currently estimated at $682,067, approximately $433 per square foot. 10126 Reseda Blvd Unit 123 is a home located in Los Angeles County with nearby schools including Northridge Academy High, Valley Academy of Arts & Sciences, and Topeka Charter School For Advanced Studies.
Ownership History
Date
Name
Owned For
Owner Type
Purchase Details
Closed on
Nov 14, 2015
Sold by
Lavond David G
Bought by
Lavond David G and David G Lavond Revocable Trust
Current Estimated Value
Purchase Details
Closed on
Nov 13, 2002
Sold by
Chung Sang Y
Bought by
Lavond David G
Home Financials for this Owner
Home Financials are based on the most recent Mortgage that was taken out on this home.
Original Mortgage
$251,000
Outstanding Balance
$104,126
Interest Rate
5.89%
Estimated Equity
$577,941
Purchase Details
Closed on
Mar 2, 2000
Sold by
Rice D Lloyd
Bought by
Chung Sang Y and Chung Sung
Home Financials for this Owner
Home Financials are based on the most recent Mortgage that was taken out on this home.
Original Mortgage
$143,200
Interest Rate
8.24%
Mortgage Type
Stand Alone First
Create a Home Valuation Report for This Property
The Home Valuation Report is an in-depth analysis detailing your home's value as well as a comparison with similar homes in the area
Home Values in the Area
Average Home Value in this Area
Purchase History
| Date | Buyer | Sale Price | Title Company |
|---|---|---|---|
| Lavond David G | -- | None Available | |
| Lavond David G | $286,000 | -- | |
| Chung Sang Y | $179,000 | Commonwealth Title |
Source: Public Records
Mortgage History
| Date | Status | Borrower | Loan Amount |
|---|---|---|---|
| Open | Lavond David G | $251,000 | |
| Previous Owner | Chung Sang Y | $143,200 | |
| Closed | Chung Sang Y | $26,850 |
Source: Public Records
Tax History Compared to Growth
Tax History
| Year | Tax Paid | Tax Assessment Tax Assessment Total Assessment is a certain percentage of the fair market value that is determined by local assessors to be the total taxable value of land and additions on the property. | Land | Improvement |
|---|---|---|---|---|
| 2025 | $5,050 | $414,198 | $103,542 | $310,656 |
| 2024 | $5,050 | $406,077 | $101,512 | $304,565 |
| 2023 | $4,953 | $398,116 | $99,522 | $298,594 |
| 2022 | $4,724 | $390,311 | $97,571 | $292,740 |
| 2021 | $4,659 | $382,658 | $95,658 | $287,000 |
| 2019 | $4,519 | $371,311 | $92,822 | $278,489 |
| 2018 | $4,452 | $364,031 | $91,002 | $273,029 |
| 2016 | $4,241 | $349,897 | $87,469 | $262,428 |
| 2015 | $4,179 | $344,643 | $86,156 | $258,487 |
| 2014 | $4,197 | $337,893 | $84,469 | $253,424 |
Source: Public Records
Map
Nearby Homes
- 10126 Reseda Blvd Unit 121
- 10126 Reseda Blvd Unit 112
- 10004 Reseda Blvd Unit D
- 18524 Mayall St Unit D
- 18526 Mayall St Unit L
- 10116 Viking Ave
- 18170 Andrea Cir N Unit 1
- 9854 Canby Ave
- 18131 Andrea Cir N Unit 4
- 18753 Mayall St
- 9763 Reseda Blvd Unit 83
- 10535 Reseda Blvd
- 9625 Yolanda Ave
- 17813 Lemarsh St
- 18741 Hillsboro Rd
- 10225 Donna Ave
- 10220 Zelzah Ave Unit 3
- 17727 Merridy St Unit 18
- 9506 Yolanda Ave
- 10721 Crebs Ave
- 10126 Reseda Blvd Unit 118
- 10126 Reseda Blvd Unit 130
- 10126 Reseda Blvd Unit 129
- 10126 Reseda Blvd Unit 128
- 10126 Reseda Blvd Unit 127
- 10126 Reseda Blvd Unit 126
- 10126 Reseda Blvd Unit 125
- 10126 Reseda Blvd Unit 124
- 10126 Reseda Blvd Unit 122
- 10126 Reseda Blvd Unit 120
- 10126 Reseda Blvd Unit 119
- 10126 Reseda Blvd Unit 117
- 10126 Reseda Blvd Unit 116
- 10126 Reseda Blvd Unit 115
- 10126 Reseda Blvd Unit 114
- 10126 Reseda Blvd Unit 113
- 10126 Reseda Blvd Unit 111
- 10126 Reseda Blvd Unit 110
- 10126 Reseda Blvd Unit 109
- 10126 Reseda Blvd Unit 108