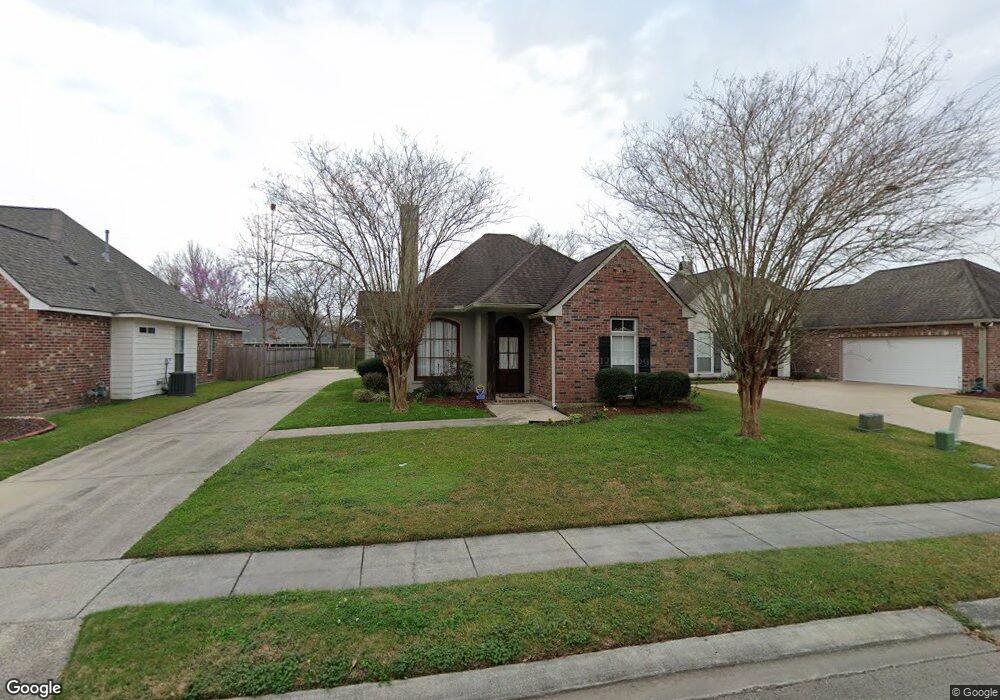
10126 Springbrook Ave Baton Rouge, LA 70810
Estimated Value: $293,425 - $312,000
3
Beds
2
Baths
1,560
Sq Ft
$197/Sq Ft
Est. Value
About This Home
This home is located at 10126 Springbrook Ave, Baton Rouge, LA 70810 and is currently estimated at $306,606, approximately $196 per square foot. 10126 Springbrook Ave is a home located in East Baton Rouge Parish with nearby schools including Westdale Middle School, Tara High School, and South Baton Rouge Charter Academy.
Ownership History
Date
Name
Owned For
Owner Type
Purchase Details
Closed on
Jun 29, 2001
Sold by
Leonard Builders Inc
Bought by
United Tax Group Llc
Current Estimated Value
Purchase Details
Closed on
Mar 29, 2000
Sold by
Leonard Builders Inc
Bought by
Obebe Terri Thomas and Obebe Adekunle A
Home Financials for this Owner
Home Financials are based on the most recent Mortgage that was taken out on this home.
Original Mortgage
$143,000
Interest Rate
8.37%
Purchase Details
Closed on
May 7, 1999
Sold by
Bluebonnet Highlands Land & Development
Bought by
Leonard Builders Inc
Home Financials for this Owner
Home Financials are based on the most recent Mortgage that was taken out on this home.
Original Mortgage
$150,000
Interest Rate
6.99%
Mortgage Type
Purchase Money Mortgage
Create a Home Valuation Report for This Property
The Home Valuation Report is an in-depth analysis detailing your home's value as well as a comparison with similar homes in the area
Home Values in the Area
Average Home Value in this Area
Purchase History
| Date | Buyer | Sale Price | Title Company |
|---|---|---|---|
| United Tax Group Llc | $1,514 | -- | |
| Obebe Terri Thomas | $143,000 | -- | |
| Leonard Builders Inc | $24,900 | -- |
Source: Public Records
Mortgage History
| Date | Status | Borrower | Loan Amount |
|---|---|---|---|
| Previous Owner | Obebe Terri Thomas | $143,000 | |
| Previous Owner | Leonard Builders Inc | $150,000 |
Source: Public Records
Tax History
| Year | Tax Paid | Tax Assessment Tax Assessment Total Assessment is a certain percentage of the fair market value that is determined by local assessors to be the total taxable value of land and additions on the property. | Land | Improvement |
|---|---|---|---|---|
| 2024 | $2,360 | $27,300 | $3,000 | $24,300 |
| 2023 | $2,371 | $23,400 | $3,000 | $20,400 |
| 2022 | $2,740 | $23,400 | $3,000 | $20,400 |
| 2021 | $2,688 | $23,400 | $3,000 | $20,400 |
| 2020 | $2,662 | $23,400 | $3,000 | $20,400 |
| 2019 | $2,498 | $21,050 | $3,000 | $18,050 |
| 2018 | $2,466 | $21,050 | $3,000 | $18,050 |
| 2017 | $2,466 | $21,050 | $3,000 | $18,050 |
| 2016 | $1,559 | $21,050 | $3,000 | $18,050 |
| 2015 | $1,292 | $18,700 | $3,000 | $15,700 |
| 2014 | $1,265 | $18,700 | $3,000 | $15,700 |
| 2013 | -- | $18,700 | $3,000 | $15,700 |
Source: Public Records
Map
Nearby Homes
- 10121 Springpark Ave
- 10325 Springpark Ave
- 10434 Springbrook Ave
- 1335 Springlake Dr
- 9456 Crandon Dr
- 2030 Springmorning Dr
- 2060 Springmorning Dr
- 9050 Parkway Dr
- 9058 Parkway Dr
- 9059 Parkway Dr
- 10681 Hilltree Dr
- 9051 Parkway Dr
- 10027 Pelican Pointe Ln
- 10109 Pelican Pointe Ln
- 10035 Pelican Pointe Ln
- 10673 Hillshire Ave
- 2121 Springstone Dr
- 2243 Spring Pointe Dr
- 9120 Parkway Dr
- 9930 Glavin Dr
- 10116 Springbrook Ave
- 10116 Springbrook Ave
- 10136 Springbrook Ave
- 10204 Springbrook Ave
- 10229 Springwind Ct
- 10239 Springwind Ct
- 10106 Springbrook Ave
- 10561 Springglen Ct
- 10214 Springbrook Ave
- 10125 Springbrook Ave
- 10249 Springwind Ct
- 10115 Springbrook Ave
- 10219 Springwind Ct
- 10571 Springglen Ct
- 10203 Springbrook Ave
- 10224 Springbrook Ave
- 10105 Springbrook Ave
- 10259 Springwind Ct
- 10213 Springbrook Ave
- 10218 Springwind Ct
Your Personal Tour Guide
Ask me questions while you tour the home.