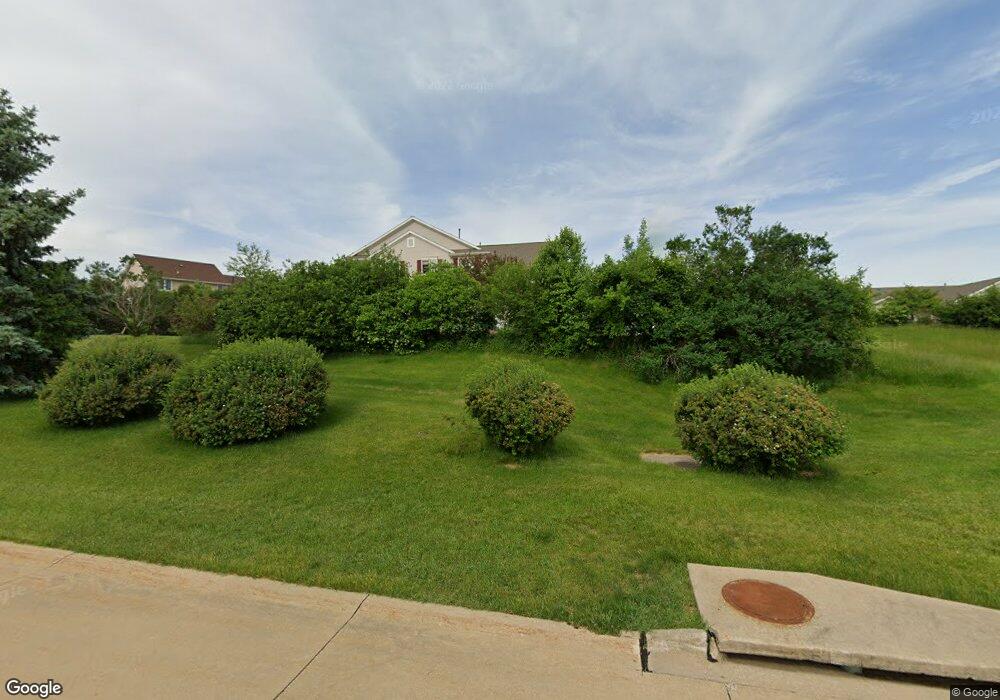
1013 74th St NE Unit 1013 Cedar Rapids, IA 52402
Estimated Value: $210,543 - $221,000
3
Beds
3
Baths
1,531
Sq Ft
$140/Sq Ft
Est. Value
About This Home
This home is located at 1013 74th St NE Unit 1013, Cedar Rapids, IA 52402 and is currently estimated at $214,886, approximately $140 per square foot. 1013 74th St NE Unit 1013 is a home located in Linn County with nearby schools including Westfield Elementary School, Oak Ridge School, and Linn-Mar High School.
Ownership History
Date
Name
Owned For
Owner Type
Purchase Details
Closed on
Aug 24, 2006
Sold by
Morarend Quinn A and Straub Morarend Cheryl L
Bought by
Stevens Kimberly D
Current Estimated Value
Home Financials for this Owner
Home Financials are based on the most recent Mortgage that was taken out on this home.
Original Mortgage
$133,800
Outstanding Balance
$80,419
Interest Rate
6.78%
Mortgage Type
FHA
Estimated Equity
$134,467
Purchase Details
Closed on
May 11, 2005
Sold by
Jerrys Homes Inc
Bought by
Morarend Quinn A and Straub Morarend Cheryl L
Home Financials for this Owner
Home Financials are based on the most recent Mortgage that was taken out on this home.
Original Mortgage
$94,950
Interest Rate
5.62%
Mortgage Type
Fannie Mae Freddie Mac
Purchase Details
Closed on
May 19, 1998
Sold by
Light Daniel E and Light Jennifer L
Bought by
Light Jennifer L
Create a Home Valuation Report for This Property
The Home Valuation Report is an in-depth analysis detailing your home's value as well as a comparison with similar homes in the area
Home Values in the Area
Average Home Value in this Area
Purchase History
| Date | Buyer | Sale Price | Title Company |
|---|---|---|---|
| Stevens Kimberly D | $135,500 | None Available | |
| Morarend Quinn A | $129,500 | -- | |
| Light Jennifer L | -- | -- |
Source: Public Records
Mortgage History
| Date | Status | Borrower | Loan Amount |
|---|---|---|---|
| Open | Stevens Kimberly D | $133,800 | |
| Previous Owner | Morarend Quinn A | $94,950 |
Source: Public Records
Tax History Compared to Growth
Tax History
| Year | Tax Paid | Tax Assessment Tax Assessment Total Assessment is a certain percentage of the fair market value that is determined by local assessors to be the total taxable value of land and additions on the property. | Land | Improvement |
|---|---|---|---|---|
| 2025 | $3,684 | $201,800 | $30,000 | $171,800 |
| 2024 | $4,104 | $188,000 | $28,000 | $160,000 |
| 2023 | $4,104 | $188,000 | $28,000 | $160,000 |
| 2022 | $3,828 | $179,600 | $26,000 | $153,600 |
| 2021 | $3,748 | $172,900 | $26,000 | $146,900 |
| 2020 | $3,748 | $159,600 | $22,000 | $137,600 |
| 2019 | $3,472 | $149,500 | $22,000 | $127,500 |
| 2018 | $3,276 | $149,500 | $22,000 | $127,500 |
| 2017 | $3,348 | $146,100 | $15,000 | $131,100 |
| 2016 | $3,148 | $140,700 | $15,000 | $125,700 |
| 2015 | $3,046 | $136,029 | $15,000 | $121,029 |
| 2014 | $3,046 | $131,949 | $15,000 | $116,949 |
| 2013 | $2,856 | $131,949 | $15,000 | $116,949 |
Source: Public Records
Map
Nearby Homes
- 7104 Doubletree Rd NE
- 1055 74th St NE Unit 1055
- 935 74th St NE Unit 1
- 6965 Doubletree Rd NE Unit 6965
- 1008 Doubletree Ct NE Unit 1008
- 1241 74th St NE Unit 1241
- 1229 Honey Creek Way NE
- 803 73rd St NE
- 7128 Summerland Ridge Rd NE
- 1027 Acacia Dr NE
- 1226 Prairieview Dr NE
- 1215 Prairieview Dr NE
- 7701 Westfield Dr NE
- 7502 Summerset Ave NE
- 7599 Summerset Ave NE
- 6715 Creekside Dr NE Unit 2
- 1127 Tiara Dr NE
- 1407 Tower Ln NE Unit 1407
- 7415 Pin Tail Dr NE
- 8139 Turtlerun Dr NE
- 1015 74th St NE Unit 1015
- 1009 74th St NE Unit 1009
- 1011 74th St NE Unit 1011
- 1017 74th St NE Unit 1017
- 1019 74th St NE Unit 1019
- 7132 E Park Ct NE
- 1021 74th St NE
- 1033 74th St NE
- 1031 74th St NE
- 1007 74th St NE Unit 1007
- 1005 74th St NE Unit 1005
- 1003 74th St NE Unit 1003
- 7135 E Park Ct NE
- 7126 E Park Ct NE
- 943 74th St NE Unit D7
- 943 74th St NE Unit D6
- 943 74th St NE
- 943 74th St NE
- 943 74th St NE Unit D3
- 943 74th St NE