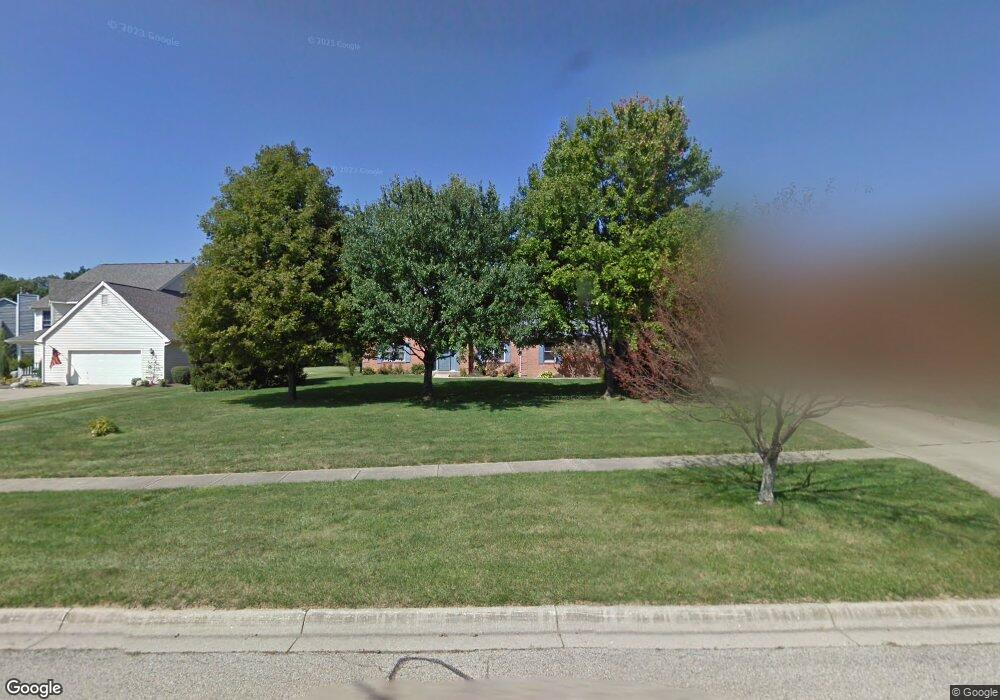
1013 Country Creek Dr Lebanon, OH 45036
Estimated Value: $473,725 - $614,000
3
Beds
3
Baths
2,548
Sq Ft
$216/Sq Ft
Est. Value
About This Home
This home is located at 1013 Country Creek Dr, Lebanon, OH 45036 and is currently estimated at $549,681, approximately $215 per square foot. 1013 Country Creek Dr is a home located in Warren County with nearby schools including Bowman Primary School, Berry Intermediate School, and Donovan Elementary School.
Ownership History
Date
Name
Owned For
Owner Type
Purchase Details
Closed on
Aug 30, 2006
Sold by
Pennington Whit E and Pennington Char
Bought by
Conn David M and Conn Donna J
Current Estimated Value
Home Financials for this Owner
Home Financials are based on the most recent Mortgage that was taken out on this home.
Original Mortgage
$216,000
Outstanding Balance
$130,422
Interest Rate
6.77%
Mortgage Type
Purchase Money Mortgage
Estimated Equity
$419,259
Purchase Details
Closed on
Nov 3, 1987
Sold by
Ward Roy and Ward Roy
Bought by
Pennington and Pennington Whit E
Purchase Details
Closed on
Mar 31, 1987
Sold by
Progressive Structures & In
Bought by
Ward and Ward Roy
Purchase Details
Closed on
Dec 31, 1984
Sold by
Progressive Structures & In
Bought by
Progressive Structures & In
Create a Home Valuation Report for This Property
The Home Valuation Report is an in-depth analysis detailing your home's value as well as a comparison with similar homes in the area
Home Values in the Area
Average Home Value in this Area
Purchase History
| Date | Buyer | Sale Price | Title Company |
|---|---|---|---|
| Conn David M | $270,000 | Midland Title | |
| Pennington | $145,000 | -- | |
| Ward | $25,000 | -- | |
| Progressive Structures & In | -- | -- |
Source: Public Records
Mortgage History
| Date | Status | Borrower | Loan Amount |
|---|---|---|---|
| Open | Conn David M | $216,000 |
Source: Public Records
Tax History Compared to Growth
Tax History
| Year | Tax Paid | Tax Assessment Tax Assessment Total Assessment is a certain percentage of the fair market value that is determined by local assessors to be the total taxable value of land and additions on the property. | Land | Improvement |
|---|---|---|---|---|
| 2024 | $5,830 | $140,390 | $35,000 | $105,390 |
| 2023 | $4,876 | $105,497 | $19,775 | $85,722 |
| 2022 | $5,082 | $105,497 | $19,775 | $85,722 |
| 2021 | $4,803 | $105,497 | $19,775 | $85,722 |
| 2020 | $5,032 | $93,359 | $17,500 | $75,859 |
| 2019 | $5,056 | $93,359 | $17,500 | $75,859 |
| 2018 | $4,333 | $93,359 | $17,500 | $75,859 |
| 2017 | $4,109 | $79,419 | $15,127 | $64,292 |
| 2016 | $4,239 | $79,419 | $15,127 | $64,292 |
| 2015 | $4,269 | $79,419 | $15,127 | $64,292 |
| 2014 | $4,446 | $79,420 | $15,130 | $64,290 |
| 2013 | $4,277 | $91,870 | $17,500 | $74,370 |
Source: Public Records
Map
Nearby Homes
- 1009 Country Creek Dr
- 1017 Country Creek Dr
- 516 Creekside Dr
- 500 Creekside Dr
- 504 Creekside Dr
- 530 Creekside Dr
- 524 Creekside Dr
- 1021 Country Creek Dr
- 512 Creekside Dr
- 1012 Country Creek Dr
- 488 Creekside Dr
- 1016 Country Creek Dr
- 1008 Country Creek Dr
- 1025 Country Creek Dr
- 1004 Country Creek Dr
- 501 Creekside Dr
- 1020 Country Creek Dr
- 484 Creekside Dr
- 8378 Creekside Dr
- 8390 Creekside Dr