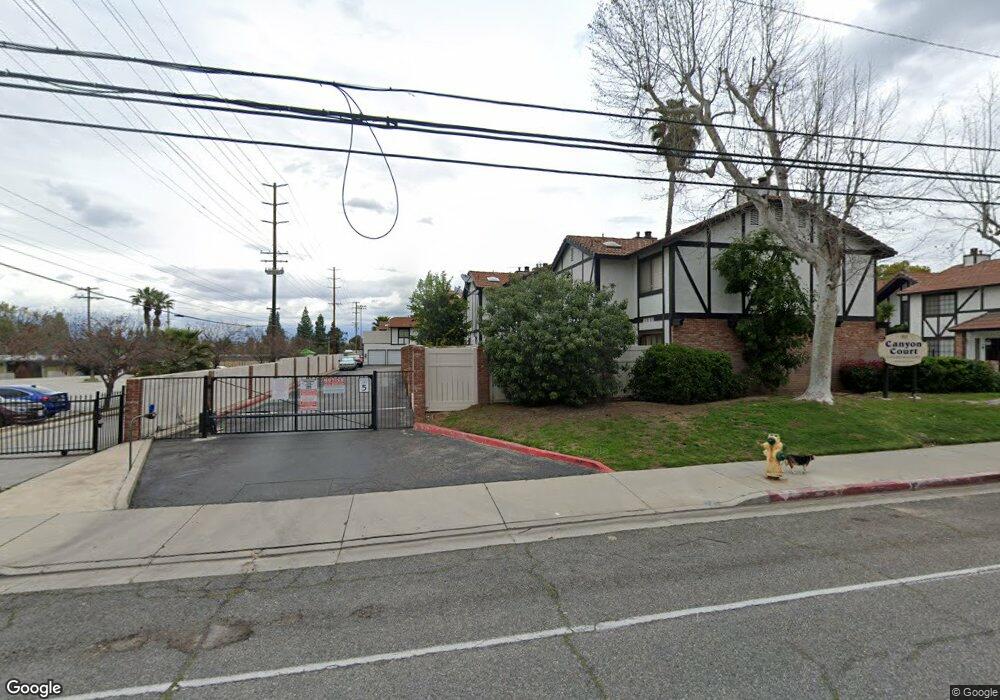
1013 W Linden St Unit 1 Riverside, CA 92507
University NeighborhoodEstimated Value: $318,000 - $417,000
2
Beds
2
Baths
1,134
Sq Ft
$321/Sq Ft
Est. Value
About This Home
This home is located at 1013 W Linden St Unit 1, Riverside, CA 92507 and is currently estimated at $364,439, approximately $321 per square foot. 1013 W Linden St Unit 1 is a home located in Riverside County with nearby schools including Highland Elementary, University Heights Middle School, and John W. North High School.
Ownership History
Date
Name
Owned For
Owner Type
Purchase Details
Closed on
Mar 15, 2021
Sold by
Lina E Matias Trust and Matias Lina E
Bought by
Matias Andrew and Matias Linda
Current Estimated Value
Home Financials for this Owner
Home Financials are based on the most recent Mortgage that was taken out on this home.
Original Mortgage
$157,500
Outstanding Balance
$140,791
Interest Rate
2.8%
Mortgage Type
Seller Take Back
Estimated Equity
$223,648
Purchase Details
Closed on
May 15, 2012
Sold by
Matias Lina E
Bought by
Matias Lina E
Purchase Details
Closed on
May 3, 1994
Sold by
Minkin Gary and Minkin Susan
Bought by
Matias Lina E
Home Financials for this Owner
Home Financials are based on the most recent Mortgage that was taken out on this home.
Original Mortgage
$59,600
Interest Rate
8.35%
Mortgage Type
Purchase Money Mortgage
Create a Home Valuation Report for This Property
The Home Valuation Report is an in-depth analysis detailing your home's value as well as a comparison with similar homes in the area
Home Values in the Area
Average Home Value in this Area
Purchase History
| Date | Buyer | Sale Price | Title Company |
|---|---|---|---|
| Matias Andrew | $225,000 | First American Title | |
| Matias Lina E | -- | None Available | |
| Matias Lina E | $74,500 | First American Title Ins Co |
Source: Public Records
Mortgage History
| Date | Status | Borrower | Loan Amount |
|---|---|---|---|
| Open | Matias Andrew | $157,500 | |
| Previous Owner | Matias Lina E | $59,600 |
Source: Public Records
Tax History Compared to Growth
Tax History
| Year | Tax Paid | Tax Assessment Tax Assessment Total Assessment is a certain percentage of the fair market value that is determined by local assessors to be the total taxable value of land and additions on the property. | Land | Improvement |
|---|---|---|---|---|
| 2025 | $2,669 | $243,545 | $64,945 | $178,600 |
| 2023 | $2,669 | $234,090 | $62,424 | $171,666 |
| 2022 | $2,609 | $229,500 | $61,200 | $168,300 |
| 2021 | $1,353 | $114,591 | $23,536 | $91,055 |
| 2020 | $1,343 | $113,417 | $23,295 | $90,122 |
| 2019 | $1,319 | $111,194 | $22,839 | $88,355 |
| 2018 | $1,294 | $109,015 | $22,392 | $86,623 |
| 2017 | $1,272 | $106,878 | $21,953 | $84,925 |
| 2016 | $1,193 | $104,783 | $21,523 | $83,260 |
| 2015 | $1,176 | $103,210 | $21,200 | $82,010 |
| 2014 | $1,164 | $101,190 | $20,786 | $80,404 |
Source: Public Records
Map
Nearby Homes
- 1013 W Linden St Unit 2
- 1130 W Blaine St Unit 204
- 1050 Athena Ct
- 2891 Canyon Crest Dr
- 587 W Blaine St
- 104 Sir Tristram Dr Unit 104
- 1313 Massachusetts Ave Unit 201
- 36 Round Table Dr
- 1329 Massachusetts Ave Unit 202
- 3085 Flanders Rd
- 1315 Massachusetts Ave Unit 101
- 3024 Wendell Way
- 1317 Massachusetts Ave Unit 202
- 1333 Massachusetts Ave Unit 201
- 39 Round Table Dr
- 1560 Massachusetts Ave Unit 123
- 1560 Massachusetts Ave Unit 142
- 1560 Massachusetts Ave
- 1560 Massachusetts Ave Unit 46
- 1341 Massachusetts Ave Unit 205
- 1013 W Linden St Unit 11
- 1013 W Linden St Unit 8
- 1013 W Linden St Unit 7
- 1013 W Linden St Unit 6
- 1013 W Linden St Unit 5
- 1013 W Linden St Unit 4
- 1013 W Linden St Unit 3
- 1013 W Linden St Unit 32
- 1013 W Linden St Unit 31
- 1013 W Linden St Unit 30
- 1013 W Linden St Unit 29
- 1013 W Linden St Unit 28
- 1013 W Linden St Unit 27
- 1013 W Linden St Unit 26
- 1013 W Linden St Unit 25
- 1013 W Linden St Unit 24
- 1013 W Linden St Unit 23
- 1013 W Linden St Unit 22
- 1013 W Linden St Unit 21
- 1013 W Linden St Unit 20