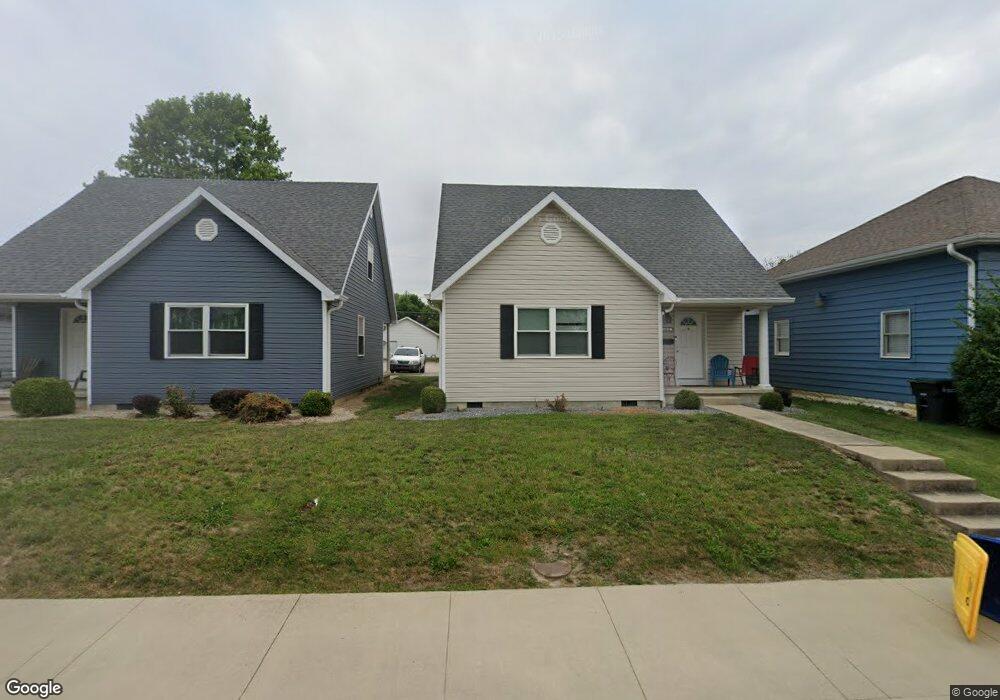
1013 W Marsh St Muncie, IN 47303
Riverside-Normal City NeighborhoodEstimated Value: $150,000 - $169,000
5
Beds
2
Baths
1,904
Sq Ft
$84/Sq Ft
Est. Value
About This Home
This home is located at 1013 W Marsh St, Muncie, IN 47303 and is currently estimated at $160,299, approximately $84 per square foot. 1013 W Marsh St is a home located in Delaware County with nearby schools including Muncie Central High School, West View Elementary School, and Northside Middle School.
Ownership History
Date
Name
Owned For
Owner Type
Purchase Details
Closed on
Sep 16, 2022
Sold by
Conrad Jacobs Llc
Bought by
Checkmate Goh Llc
Current Estimated Value
Home Financials for this Owner
Home Financials are based on the most recent Mortgage that was taken out on this home.
Original Mortgage
$1,592,779
Outstanding Balance
$961,461
Interest Rate
5.13%
Mortgage Type
Credit Line Revolving
Estimated Equity
-$801,162
Purchase Details
Closed on
Mar 3, 2015
Sold by
Weaver Marshall S and Weaver Joyce A
Bought by
Concrad Jacobs Llc
Create a Home Valuation Report for This Property
The Home Valuation Report is an in-depth analysis detailing your home's value as well as a comparison with similar homes in the area
Home Values in the Area
Average Home Value in this Area
Purchase History
| Date | Buyer | Sale Price | Title Company |
|---|---|---|---|
| Checkmate Goh Llc | -- | -- | |
| Concrad Jacobs Llc | -- | -- |
Source: Public Records
Mortgage History
| Date | Status | Borrower | Loan Amount |
|---|---|---|---|
| Open | Checkmate Goh Llc | $1,592,779 |
Source: Public Records
Tax History Compared to Growth
Tax History
| Year | Tax Paid | Tax Assessment Tax Assessment Total Assessment is a certain percentage of the fair market value that is determined by local assessors to be the total taxable value of land and additions on the property. | Land | Improvement |
|---|---|---|---|---|
| 2024 | $2,490 | $118,600 | $14,700 | $103,900 |
| 2023 | $2,094 | $98,800 | $12,200 | $86,600 |
| 2022 | $1,884 | $88,300 | $12,200 | $76,100 |
| 2021 | $1,738 | $81,000 | $11,100 | $69,900 |
| 2020 | $2,028 | $70,400 | $10,100 | $60,300 |
| 2019 | $1,835 | $71,300 | $10,100 | $61,200 |
| 2018 | $1,506 | $69,400 | $10,100 | $59,300 |
| 2017 | $1,528 | $70,500 | $10,200 | $60,300 |
| 2016 | $1,462 | $67,200 | $9,700 | $57,500 |
| 2014 | $1,219 | $58,300 | $9,200 | $49,100 |
| 2013 | -- | $57,800 | $9,200 | $48,600 |
Source: Public Records
Map
Nearby Homes
- 908 W Neely Ave
- 1224 W Carson St
- 1119 W Bethel Ave
- 712 W Queen St
- 709 W Riverside Ave
- 601 W Riverside Ave
- 1623 N Janney Ave
- 1300 W University Ave
- 1804 N Milton St
- 2016 N Ball Ave
- 321 W Weber Dr
- 800-802 W North St
- 701 W Waid Ave
- 1000 W Waid Ave
- 1401 N Walnut St
- 747 N Mulberry St
- 202 E Maple St
- 210 E Ward Ave
- 802 1/2 N Mulberry St
- 1004 N Meadow Ln
- 1009 W Marsh St
- 1017 W Marsh St
- 1005 W Marsh St
- 1021 W Marsh St
- 1001 W Marsh St
- 1025 W Marsh St
- 1010 W Neely Ave
- 1012 W Neely Ave
- 1008 W Neely Ave
- 1016 W Neely Ave
- 1004 W Neely Ave
- 1029 W Marsh St
- 1012 W Marsh St
- 1008 W Marsh St
- 1016 W Marsh St
- 1000 W Neely Ave
- 1020 W Neely Ave
- 1020 W Marsh St
- 1004 W Marsh St
- 1212 N Linden St