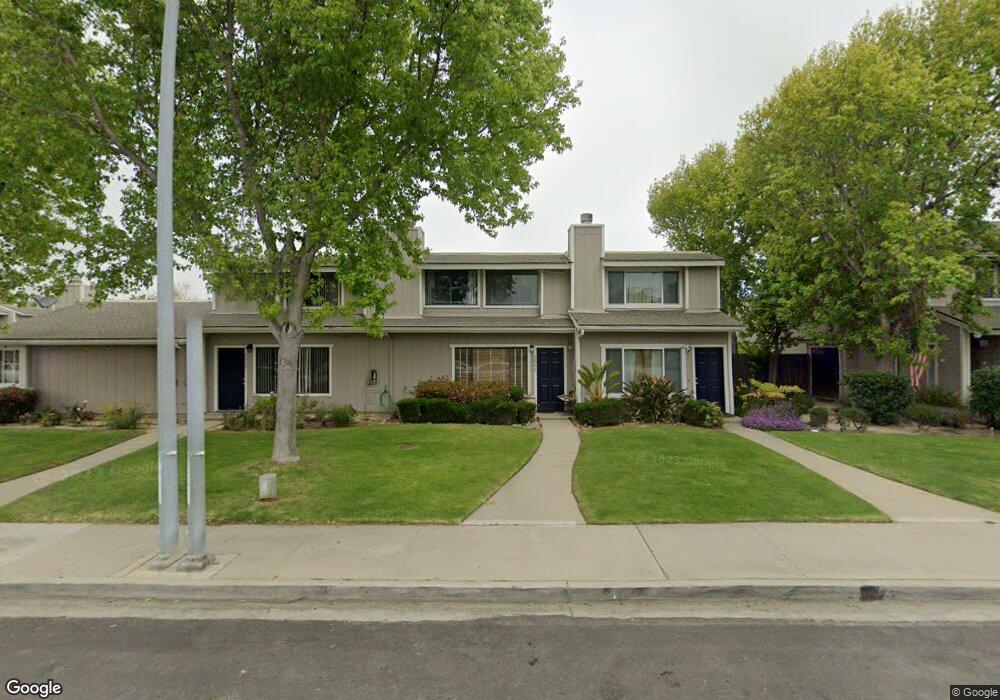
1013 W Walnut Ave Lompoc, CA 93436
Estimated Value: $358,000 - $398,000
3
Beds
3
Baths
1,254
Sq Ft
$308/Sq Ft
Est. Value
About This Home
This home is located at 1013 W Walnut Ave, Lompoc, CA 93436 and is currently estimated at $386,311, approximately $308 per square foot. 1013 W Walnut Ave is a home located in Santa Barbara County with nearby schools including Miguelito Elementary School, Lompoc Valley Middle School, and Lompoc High School.
Ownership History
Date
Name
Owned For
Owner Type
Purchase Details
Closed on
Jun 5, 2015
Sold by
Darling Vlasta and Darling Christopher
Bought by
Darling Vlasta
Current Estimated Value
Home Financials for this Owner
Home Financials are based on the most recent Mortgage that was taken out on this home.
Original Mortgage
$51,600
Outstanding Balance
$39,808
Interest Rate
3.64%
Mortgage Type
New Conventional
Estimated Equity
$346,503
Purchase Details
Closed on
Mar 7, 2012
Sold by
Dillon Clifford
Bought by
Dillon Vlasta
Purchase Details
Closed on
Oct 21, 2008
Sold by
Dillon Vlasta
Bought by
Dillon Clifford and Dillon Vlasta
Purchase Details
Closed on
Jan 11, 1999
Sold by
Cresswell Mark E
Bought by
Dillin Clifford and Dillon Vlasta
Home Financials for this Owner
Home Financials are based on the most recent Mortgage that was taken out on this home.
Original Mortgage
$73,440
Interest Rate
6.77%
Mortgage Type
VA
Create a Home Valuation Report for This Property
The Home Valuation Report is an in-depth analysis detailing your home's value as well as a comparison with similar homes in the area
Home Values in the Area
Average Home Value in this Area
Purchase History
| Date | Buyer | Sale Price | Title Company |
|---|---|---|---|
| Darling Vlasta | -- | First American Title Company | |
| Dillon Vlasta | -- | None Available | |
| Dillon Clifford | -- | None Available | |
| Dillin Clifford | $72,000 | Chicago Title Co |
Source: Public Records
Mortgage History
| Date | Status | Borrower | Loan Amount |
|---|---|---|---|
| Open | Darling Vlasta | $51,600 | |
| Closed | Dillin Clifford | $73,440 |
Source: Public Records
Tax History
| Year | Tax Paid | Tax Assessment Tax Assessment Total Assessment is a certain percentage of the fair market value that is determined by local assessors to be the total taxable value of land and additions on the property. | Land | Improvement |
|---|---|---|---|---|
| 2025 | $1,250 | $112,846 | $39,180 | $73,666 |
| 2023 | $1,250 | $108,465 | $37,659 | $70,806 |
| 2022 | $1,228 | $106,339 | $36,921 | $69,418 |
| 2021 | $1,240 | $104,255 | $36,198 | $68,057 |
| 2020 | $1,228 | $103,187 | $35,827 | $67,360 |
| 2019 | $1,207 | $101,165 | $35,125 | $66,040 |
| 2018 | $1,188 | $99,183 | $34,437 | $64,746 |
| 2017 | $1,166 | $97,239 | $33,762 | $63,477 |
| 2016 | $1,145 | $95,333 | $33,100 | $62,233 |
| 2014 | -- | $92,064 | $31,965 | $60,099 |
Source: Public Records
Map
Nearby Homes
Your Personal Tour Guide
Ask me questions while you tour the home.