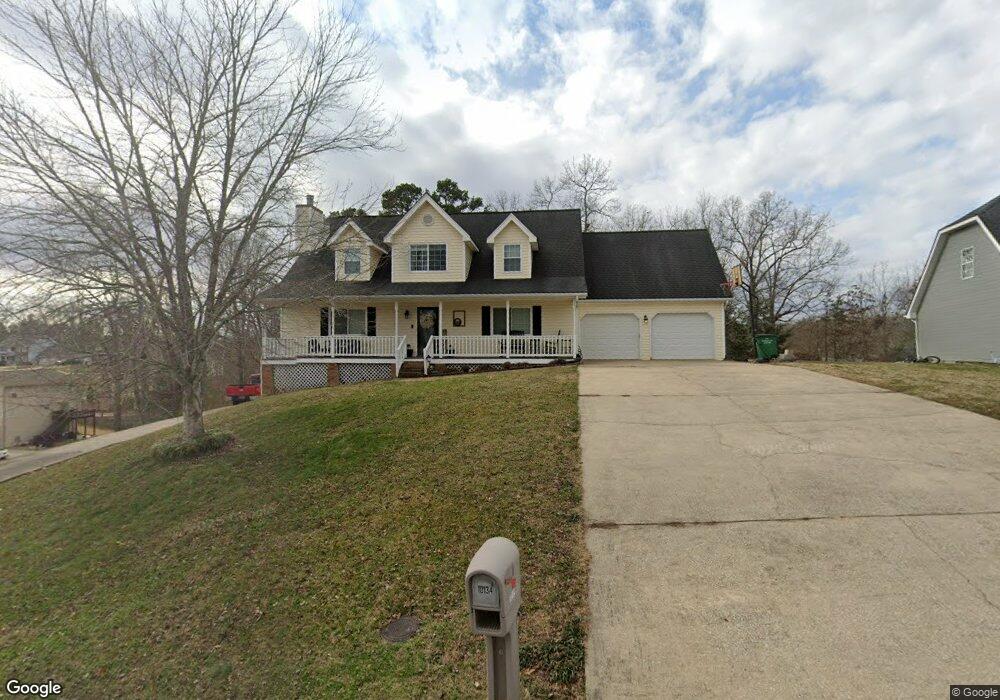
10134 Rolling Wind Dr Unit 3 Soddy Daisy, TN 37379
Estimated Value: $493,000 - $527,000
--
Bed
1
Bath
2,968
Sq Ft
$172/Sq Ft
Est. Value
About This Home
This home is located at 10134 Rolling Wind Dr Unit 3, Soddy Daisy, TN 37379 and is currently estimated at $509,408, approximately $171 per square foot. 10134 Rolling Wind Dr Unit 3 is a home located in Hamilton County with nearby schools including Loftis Middle School.
Ownership History
Date
Name
Owned For
Owner Type
Purchase Details
Closed on
Oct 26, 2017
Sold by
Wilkey Ryan N and Wilkey Crystal
Bought by
Webb Geoff and Webb Tabitha
Current Estimated Value
Home Financials for this Owner
Home Financials are based on the most recent Mortgage that was taken out on this home.
Original Mortgage
$242,250
Outstanding Balance
$202,887
Interest Rate
3.83%
Mortgage Type
New Conventional
Estimated Equity
$306,521
Purchase Details
Closed on
Nov 12, 2015
Sold by
Elrod Jake A
Bought by
Wilkey Ryan N
Home Financials for this Owner
Home Financials are based on the most recent Mortgage that was taken out on this home.
Original Mortgage
$171,000
Interest Rate
3.87%
Mortgage Type
New Conventional
Purchase Details
Closed on
Mar 22, 2010
Sold by
Elrod Malcolm M and Elrod Patricia L
Bought by
Elrod Jake A
Home Financials for this Owner
Home Financials are based on the most recent Mortgage that was taken out on this home.
Original Mortgage
$158,577
Interest Rate
5.37%
Mortgage Type
FHA
Create a Home Valuation Report for This Property
The Home Valuation Report is an in-depth analysis detailing your home's value as well as a comparison with similar homes in the area
Home Values in the Area
Average Home Value in this Area
Purchase History
| Date | Buyer | Sale Price | Title Company |
|---|---|---|---|
| Webb Geoff | $255,000 | Lakeside Title Co | |
| Wilkey Ryan N | $180,000 | None Available | |
| Elrod Jake A | $175,000 | First Title |
Source: Public Records
Mortgage History
| Date | Status | Borrower | Loan Amount |
|---|---|---|---|
| Open | Webb Geoff | $242,250 | |
| Previous Owner | Wilkey Ryan N | $171,000 | |
| Previous Owner | Elrod Jake A | $158,577 |
Source: Public Records
Tax History Compared to Growth
Tax History
| Year | Tax Paid | Tax Assessment Tax Assessment Total Assessment is a certain percentage of the fair market value that is determined by local assessors to be the total taxable value of land and additions on the property. | Land | Improvement |
|---|---|---|---|---|
| 2024 | $2,056 | $91,900 | $0 | $0 |
| 2023 | $2,065 | $91,900 | $0 | $0 |
| 2022 | $2,065 | $91,900 | $0 | $0 |
| 2021 | $2,065 | $91,900 | $0 | $0 |
| 2020 | $1,770 | $63,700 | $0 | $0 |
| 2019 | $1,770 | $63,700 | $0 | $0 |
| 2018 | $1,770 | $63,700 | $0 | $0 |
| 2017 | $1,347 | $48,375 | $0 | $0 |
| 2016 | $1,290 | $0 | $0 | $0 |
| 2015 | $1,290 | $46,325 | $0 | $0 |
| 2014 | $1,290 | $0 | $0 | $0 |
Source: Public Records
Map
Nearby Homes
- 9901 Breeze Hill Ln
- 10041 Rolling Wind Dr
- 2033 Angler Dr
- 2522 W Wind Dr
- 10105 Hixson Pike
- 9802 Shoreline Heights Dr
- 1724 Magnum Ln
- 10160 Hunters Hollow Dr
- 10166 Hunters Hollow Dr
- 9824 Waterside Way
- 2031 Millard Rd
- 11111 Hixson Pike
- 2109 Millard Rd
- 9416 Thrasher Trail
- 2524 Lyons Ln
- 1818 Millard Rd
- 9429 Hackberry Ln
- 1848 Coffee Tree Ln
- 2119 Collins Ln
- 2125 Port Royal Dr
- 10134 Rolling Wind Dr
- 10132 Rolling Wind Dr
- 2407 Westwind Dr
- 10133 Rolling Wind Dr
- 10135 Rolling Wind Dr
- 2407 W Wind Dr
- 9955 Rolling Wind Dr
- 9955 Rolling Wind Dr Unit 3
- 10128 Rolling Wind Dr Unit 3
- 10129 Rolling Wind Dr
- 10129 Rolling Wind Dr Unit 3
- 9951 Rolling Wind Dr
- 10005 Rolling Wind Dr
- 2409 Westwind Dr
- 0 Rolling Wind Dr
- 9949 Rolling Wind Dr
- 9949 Rolling Wind Dr Unit 85
- 2413 Westwind Dr
- 10126 Rolling Wind Dr
- 10126 Rolling Wind Dr Unit 104