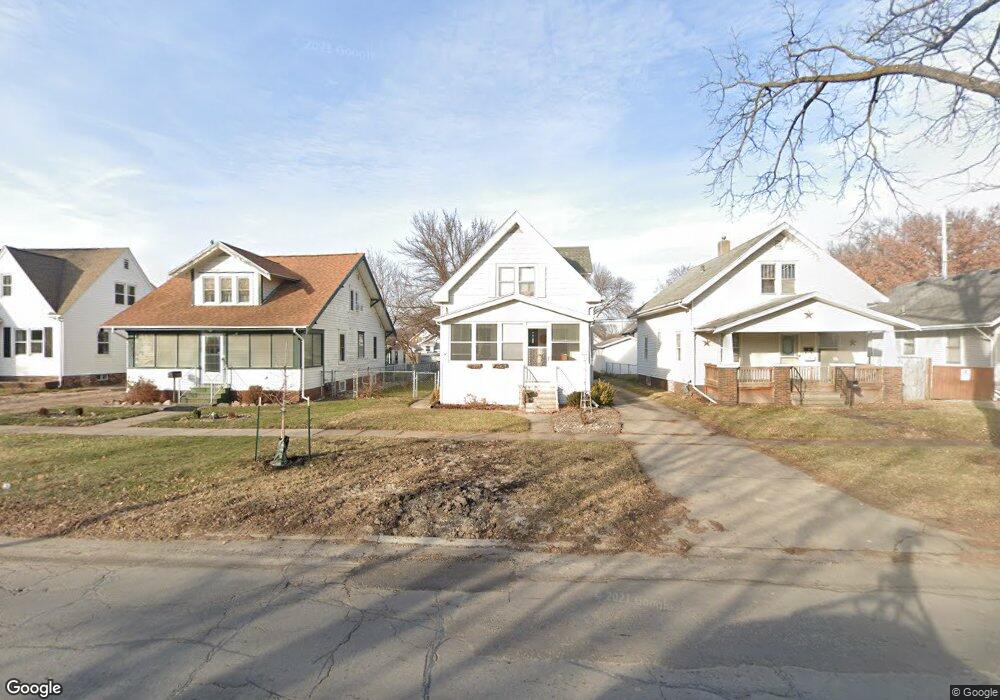
1014 F Ave NW Cedar Rapids, IA 52405
Northwest Area NeighborhoodEstimated Value: $124,456 - $142,000
2
Beds
1
Bath
972
Sq Ft
$139/Sq Ft
Est. Value
About This Home
This home is located at 1014 F Ave NW, Cedar Rapids, IA 52405 and is currently estimated at $134,864, approximately $138 per square foot. 1014 F Ave NW is a home located in Linn County with nearby schools including Junction City Elementary School, Harrison Elementary School, and Kentucky Tech - Ashland Reg Tech Center.
Ownership History
Date
Name
Owned For
Owner Type
Purchase Details
Closed on
Jul 10, 2011
Sold by
Gann Brandon E and Gann Tammy A
Bought by
Geissler Lisa E
Current Estimated Value
Home Financials for this Owner
Home Financials are based on the most recent Mortgage that was taken out on this home.
Original Mortgage
$73,600
Outstanding Balance
$50,897
Interest Rate
4.62%
Mortgage Type
New Conventional
Estimated Equity
$83,967
Purchase Details
Closed on
Apr 29, 2009
Sold by
Banks Belinda L
Bought by
Gann Brandon E and Adams Tammy A
Home Financials for this Owner
Home Financials are based on the most recent Mortgage that was taken out on this home.
Original Mortgage
$90,333
Interest Rate
4.9%
Mortgage Type
FHA
Purchase Details
Closed on
Jun 14, 1999
Sold by
Adams Mary Jean
Bought by
Banks Belinda L
Home Financials for this Owner
Home Financials are based on the most recent Mortgage that was taken out on this home.
Original Mortgage
$66,000
Interest Rate
6.99%
Create a Home Valuation Report for This Property
The Home Valuation Report is an in-depth analysis detailing your home's value as well as a comparison with similar homes in the area
Home Values in the Area
Average Home Value in this Area
Purchase History
| Date | Buyer | Sale Price | Title Company |
|---|---|---|---|
| Geissler Lisa E | $91,500 | None Available | |
| Gann Brandon E | $91,500 | None Available | |
| Banks Belinda L | $69,000 | -- |
Source: Public Records
Mortgage History
| Date | Status | Borrower | Loan Amount |
|---|---|---|---|
| Open | Geissler Lisa E | $73,600 | |
| Previous Owner | Gann Brandon E | $90,333 | |
| Previous Owner | Banks Belinda L | $66,000 |
Source: Public Records
Tax History Compared to Growth
Tax History
| Year | Tax Paid | Tax Assessment Tax Assessment Total Assessment is a certain percentage of the fair market value that is determined by local assessors to be the total taxable value of land and additions on the property. | Land | Improvement |
|---|---|---|---|---|
| 2025 | $1,646 | $118,300 | $27,000 | $91,300 |
| 2024 | $1,690 | $110,200 | $25,000 | $85,200 |
| 2023 | $1,690 | $103,500 | $22,000 | $81,500 |
| 2022 | $169,000 | $89,000 | $22,000 | $67,000 |
| 2021 | $1,634 | $87,800 | $22,000 | $65,800 |
| 2020 | $1,710 | $86,100 | $20,000 | $66,100 |
| 2019 | $1,508 | $78,500 | $16,000 | $62,500 |
| 2018 | $1,402 | $78,500 | $16,000 | $62,500 |
| 2017 | $1,390 | $72,300 | $16,000 | $56,300 |
| 2016 | $1,537 | $72,300 | $16,000 | $56,300 |
| 2015 | $1,573 | $73,974 | $16,000 | $57,974 |
| 2014 | $1,388 | $73,974 | $16,000 | $57,974 |
| 2013 | $1,354 | $73,974 | $16,000 | $57,974 |
Source: Public Records
Map
Nearby Homes
- 1073 G Ave NW
- 819 G Ave NW
- 816 9th St NW
- 1016 H Ave NW
- 720 E Ave NW
- 716 F Ave NW
- 714 East Ave NW
- 1015 Pawnee Dr NW
- 217 11th St NW
- 1126 13th St NW
- 1020 A Ave NW
- 1130 13th St NW
- 718 4th St NW
- 290 Highland Dr NW
- 1222 8th St NW
- 1311 Burch Ave NW
- 263 Highland Dr NW
- 1238 Ellis Blvd NW
- 235 Highland Dr NW
- 1649 B Ave NW