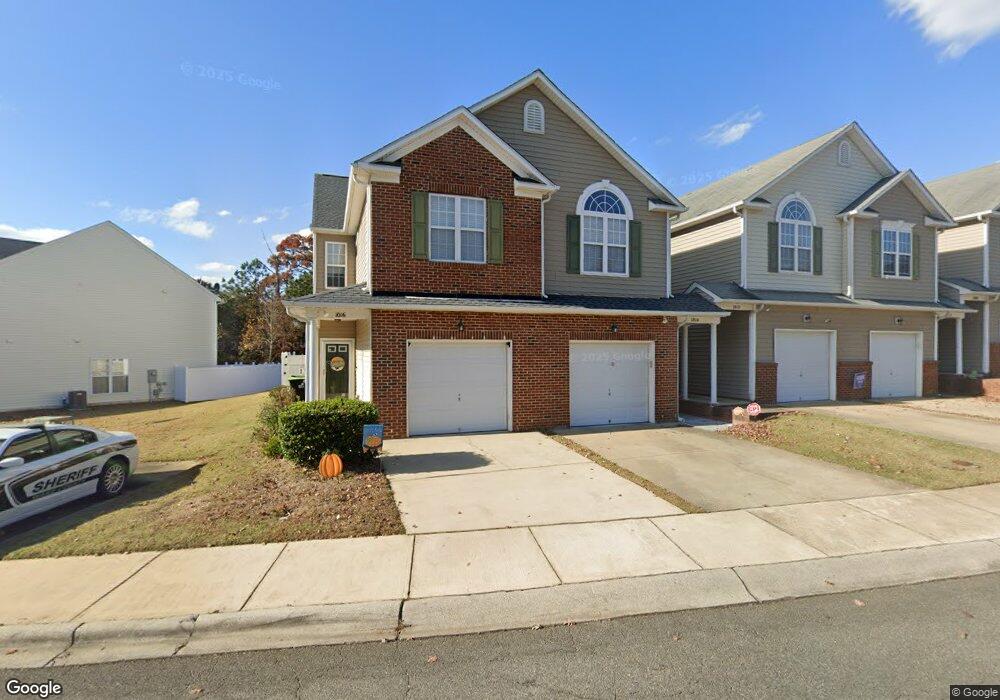
1014 Hadel Place Knightdale, NC 27545
Estimated Value: $256,000 - $268,000
3
Beds
3
Baths
1,403
Sq Ft
$186/Sq Ft
Est. Value
About This Home
This home is located at 1014 Hadel Place, Knightdale, NC 27545 and is currently estimated at $261,395, approximately $186 per square foot. 1014 Hadel Place is a home located in Wake County with nearby schools including Hodge Road Elementary School, Neuse River Middle School, and Knightdale High.
Ownership History
Date
Name
Owned For
Owner Type
Purchase Details
Closed on
Jun 28, 2022
Sold by
Owoh Steven E and Owoh Patrice Cassandra
Bought by
Owoh Steven E and Owens Cassandra Patrice
Current Estimated Value
Purchase Details
Closed on
Dec 2, 2019
Sold by
Sneed Carrie R and Sneed Abraham
Bought by
Owoh Steven E
Home Financials for this Owner
Home Financials are based on the most recent Mortgage that was taken out on this home.
Original Mortgage
$8,000
Interest Rate
3.68%
Mortgage Type
New Conventional
Purchase Details
Closed on
Mar 15, 2005
Sold by
Mc Developers Llc
Bought by
Perry Carrie Richardson
Home Financials for this Owner
Home Financials are based on the most recent Mortgage that was taken out on this home.
Original Mortgage
$87,520
Interest Rate
5.6%
Mortgage Type
Fannie Mae Freddie Mac
Create a Home Valuation Report for This Property
The Home Valuation Report is an in-depth analysis detailing your home's value as well as a comparison with similar homes in the area
Home Values in the Area
Average Home Value in this Area
Purchase History
| Date | Buyer | Sale Price | Title Company |
|---|---|---|---|
| Owoh Steven E | -- | South John B | |
| Owoh Steven E | $175,000 | None Available | |
| Perry Carrie Richardson | $110,000 | -- |
Source: Public Records
Mortgage History
| Date | Status | Borrower | Loan Amount |
|---|---|---|---|
| Previous Owner | Owoh Steven E | $8,000 | |
| Previous Owner | Owoh Steven E | $171,830 | |
| Previous Owner | Perry Carrie Richardson | $87,520 | |
| Closed | Perry Carrie Richardson | $21,880 |
Source: Public Records
Tax History Compared to Growth
Tax History
| Year | Tax Paid | Tax Assessment Tax Assessment Total Assessment is a certain percentage of the fair market value that is determined by local assessors to be the total taxable value of land and additions on the property. | Land | Improvement |
|---|---|---|---|---|
| 2025 | $2,425 | $251,293 | $55,000 | $196,293 |
| 2024 | $2,416 | $251,293 | $55,000 | $196,293 |
| 2023 | $1,826 | $163,162 | $27,000 | $136,162 |
| 2022 | $1,765 | $163,162 | $27,000 | $136,162 |
| 2021 | $1,684 | $163,162 | $27,000 | $136,162 |
| 2020 | $1,684 | $163,162 | $27,000 | $136,162 |
| 2019 | $1,425 | $122,081 | $22,000 | $100,081 |
| 2018 | $1,344 | $122,081 | $22,000 | $100,081 |
| 2017 | $1,296 | $122,081 | $22,000 | $100,081 |
| 2016 | $1,278 | $122,081 | $22,000 | $100,081 |
| 2015 | $1,378 | $129,969 | $25,000 | $104,969 |
| 2014 | $1,330 | $129,969 | $25,000 | $104,969 |
Source: Public Records
Map
Nearby Homes
- 1010 Hadel Place
- 910 Savin Landing
- 907 Savin Landing
- 114 Montview Way
- 1308 Plexor Ln
- 1214 Delham Rd
- 1122 Delham Rd
- 4809 Smarty Jones Dr
- 1006 Trail Stream Way
- 4707 Smarty Jones Dr
- 1007 Olde Midway Ct
- 1209 Agile Dr
- 4611 Dr
- 2523 Ferdinand Dr
- 2111 Old Rosebud Dr
- 1004 Clay Hill Dr
- 1227 Sunday Silence Dr
- 3010 Stamford Green Dr
- 1508 Hodge Rd
- 1101 Redwood Valley Ln
- 1012 Hadel Place
- 1016 Hadel Place
- 1008 Hadel Place
- 1006 Hadel Place
- 1102 Hadel Place
- 1004 Hadel Place
- 1104 Hadel Place
- 1002 Hadel Place
- 1106 Hadel Place
- 1007 Hadel Place
- 1005 Hadel Place
- 1009 Hadel Place
- 1003 Hadel Place
- 1108 Hadel Place
- 1011 Hadel Place
- 1001 Hadel Place
- 1110 Hadel Place
- 1101 Hadel Place
- 1103 Hadel Place
- 1105 Hadel Place