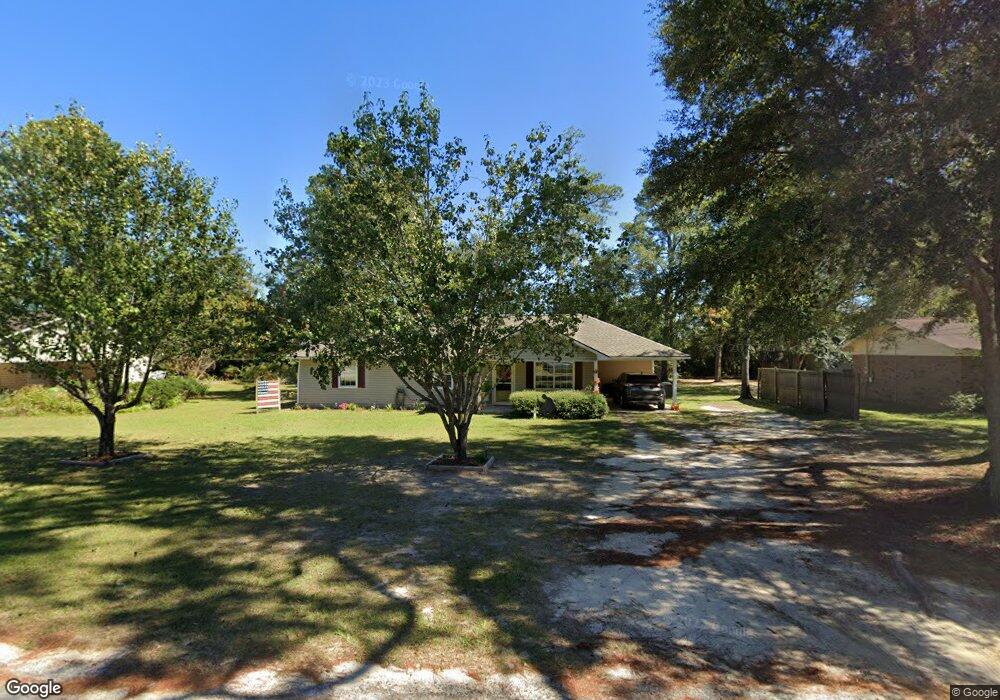
1014 Jackson St Blackshear, GA 31516
Estimated Value: $182,000 - $211,000
3
Beds
2
Baths
1,400
Sq Ft
$138/Sq Ft
Est. Value
About This Home
This home is located at 1014 Jackson St, Blackshear, GA 31516 and is currently estimated at $193,593, approximately $138 per square foot. 1014 Jackson St is a home located in Pierce County with nearby schools including Pierce County High School, Southeast Christian Academy, and Truth Christian Academy.
Ownership History
Date
Name
Owned For
Owner Type
Purchase Details
Closed on
Apr 13, 2021
Sold by
Grace Sharon M
Bought by
Sims Sharon and Porter Madhi Grace
Current Estimated Value
Purchase Details
Closed on
Nov 4, 2004
Sold by
Morgan Charles L
Bought by
Grace Sharon M
Purchase Details
Closed on
Feb 22, 2001
Sold by
Strickland David E
Bought by
Morgan Charles L
Purchase Details
Closed on
Dec 21, 1999
Sold by
Strickland Carolyn
Bought by
Strickland David E
Purchase Details
Closed on
Nov 14, 1975
Sold by
Pierce Development Company Inc
Bought by
Strickland Carolyn Ayres
Purchase Details
Closed on
Aug 8, 1963
Sold by
Wood James N Etal
Bought by
Russell Carroll
Create a Home Valuation Report for This Property
The Home Valuation Report is an in-depth analysis detailing your home's value as well as a comparison with similar homes in the area
Home Values in the Area
Average Home Value in this Area
Purchase History
| Date | Buyer | Sale Price | Title Company |
|---|---|---|---|
| Sims Sharon | -- | -- | |
| Grace Sharon M | $79,000 | -- | |
| Morgan Charles L | $70,200 | -- | |
| Strickland David E | -- | -- | |
| Strickland Carolyn Ayres | -- | -- | |
| Russell Carroll | -- | -- |
Source: Public Records
Tax History
| Year | Tax Paid | Tax Assessment Tax Assessment Total Assessment is a certain percentage of the fair market value that is determined by local assessors to be the total taxable value of land and additions on the property. | Land | Improvement |
|---|---|---|---|---|
| 2025 | $1,972 | $63,984 | $13,800 | $50,184 |
| 2024 | $1,972 | $61,484 | $13,800 | $47,684 |
| 2023 | $1,956 | $60,996 | $13,800 | $47,196 |
| 2022 | $1,612 | $42,428 | $3,223 | $39,205 |
| 2021 | $1,667 | $40,767 | $3,223 | $37,544 |
| 2020 | $1,619 | $39,105 | $3,223 | $35,882 |
| 2019 | $1,619 | $39,105 | $3,223 | $35,882 |
| 2018 | $1,555 | $37,444 | $3,223 | $34,221 |
| 2017 | $1,518 | $36,447 | $3,223 | $33,224 |
| 2016 | $1,514 | $36,447 | $3,223 | $33,224 |
| 2015 | $1,201 | $36,447 | $3,223 | $33,224 |
| 2014 | $1,201 | $36,447 | $3,223 | $33,224 |
| 2013 | $1,201 | $36,447 | $3,222 | $33,224 |
Source: Public Records
Map
Nearby Homes
- 6034 Turkey Oak Rd
- 331 Central Ave W
- 3019 Aragon Ct
- 241 Strickland Ave
- 402 Mcgregor St
- TBD Trudie Rd
- 315 Strickland Ave
- 4096 U S 84
- 106 Southern Oaks Ln
- ST. ROUTE 121 Georgia 121
- 420 Greenleaf St
- 622 E Main St
- 543 Church St
- 0 Trudie Rd
- 3551 Cason Rd
- 517 Lazy Ln
- 3360 Strickland Avenue Extension
- 121 Beaver Dr
- 918 Main St
- 854 Jenkins St
Your Personal Tour Guide
Ask me questions while you tour the home.