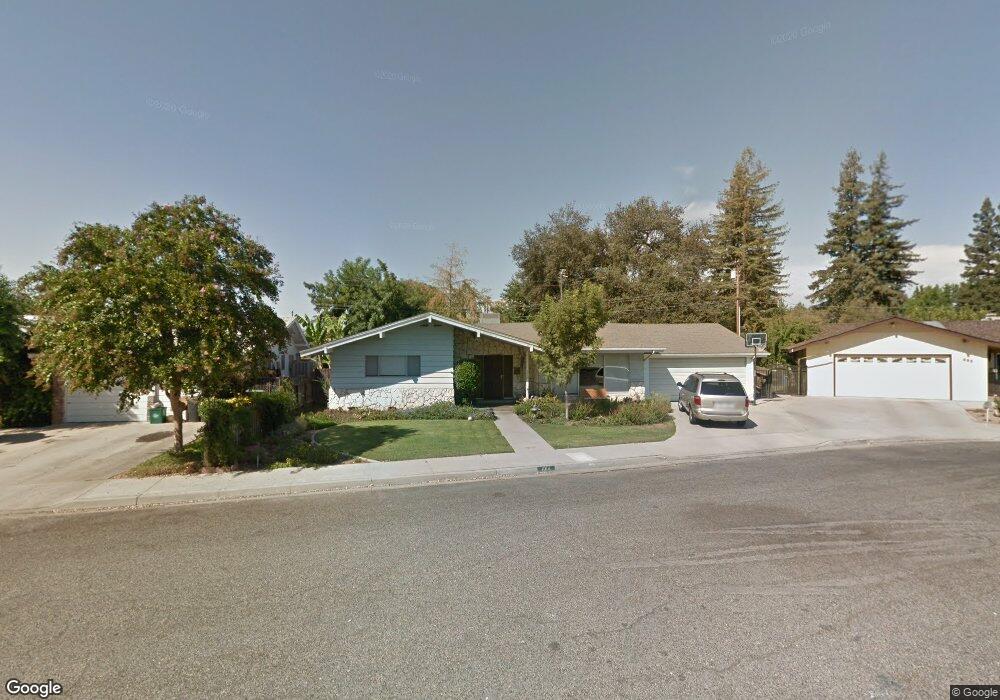
1014 Kings Drive Cir Reedley, CA 93654
Estimated Value: $381,097 - $452,000
3
Beds
3
Baths
1,724
Sq Ft
$238/Sq Ft
Est. Value
About This Home
This home is located at 1014 Kings Drive Cir, Reedley, CA 93654 and is currently estimated at $410,024, approximately $237 per square foot. 1014 Kings Drive Cir is a home located in Fresno County with nearby schools including Riverview Elementary School, Reedley High School, and Reedley Middle College High.
Ownership History
Date
Name
Owned For
Owner Type
Purchase Details
Closed on
Jul 13, 2004
Sold by
Bonds Gloria
Bought by
Marsh Steven J and Marsh Nancy A
Current Estimated Value
Home Financials for this Owner
Home Financials are based on the most recent Mortgage that was taken out on this home.
Original Mortgage
$168,000
Outstanding Balance
$83,827
Interest Rate
6.31%
Mortgage Type
New Conventional
Estimated Equity
$326,197
Purchase Details
Closed on
Jun 15, 2004
Sold by
Bonds Lloyd and Bonds Gloria J
Bought by
Marsh Steven J and Marsh Nancy A
Home Financials for this Owner
Home Financials are based on the most recent Mortgage that was taken out on this home.
Original Mortgage
$168,000
Outstanding Balance
$83,827
Interest Rate
6.31%
Mortgage Type
New Conventional
Estimated Equity
$326,197
Purchase Details
Closed on
Oct 21, 2003
Sold by
Bonds Gloria
Bought by
Bonds Llyod and Bonds Gloria J
Create a Home Valuation Report for This Property
The Home Valuation Report is an in-depth analysis detailing your home's value as well as a comparison with similar homes in the area
Home Values in the Area
Average Home Value in this Area
Purchase History
| Date | Buyer | Sale Price | Title Company |
|---|---|---|---|
| Marsh Steven J | -- | Stewart Title Of Fresno | |
| Marsh Steven J | $210,000 | Stewart Title Of Fresno | |
| Bonds Lloyd | -- | Stewart Title Of Fresno | |
| Bonds Llyod | -- | -- |
Source: Public Records
Mortgage History
| Date | Status | Borrower | Loan Amount |
|---|---|---|---|
| Open | Marsh Steven J | $168,000 | |
| Closed | Marsh Steven J | $42,000 |
Source: Public Records
Tax History Compared to Growth
Tax History
| Year | Tax Paid | Tax Assessment Tax Assessment Total Assessment is a certain percentage of the fair market value that is determined by local assessors to be the total taxable value of land and additions on the property. | Land | Improvement |
|---|---|---|---|---|
| 2025 | $3,280 | $292,708 | $69,687 | $223,021 |
| 2023 | $3,245 | $281,344 | $66,982 | $214,362 |
| 2022 | $3,242 | $275,828 | $65,669 | $210,159 |
| 2021 | $2,952 | $251,700 | $64,200 | $187,500 |
| 2020 | $2,973 | $249,200 | $63,600 | $185,600 |
| 2019 | $2,896 | $244,400 | $62,400 | $182,000 |
| 2018 | $2,885 | $239,700 | $61,200 | $178,500 |
| 2017 | $2,753 | $235,000 | $60,000 | $175,000 |
| 2016 | $2,136 | $177,667 | $42,132 | $135,535 |
| 2015 | $2,064 | $175,000 | $41,500 | $133,500 |
| 2014 | $1,998 | $166,800 | $39,600 | $127,200 |
Source: Public Records
Map
Nearby Homes
- 1178 Beechwood Cir
- 1044 K St
- 2043 11th St
- 195 N Kings Dr
- 957 S Hope Ave
- 1205 F St
- 1010 D St
- 1300 W Olson Ave Unit 158
- 1300 W Olson Ave Unit 61
- 1300 W Olson Ave Unit 75
- 1300 W Olson Ave Unit 59
- 1300 W Olson Ave Unit 155
- 1300 W Olson Ave Unit 97
- 1300 W Olson Ave Unit 131
- 1300 W Olson Ave Unit 29
- 1300 W Olson Ave Unit 52
- 8912 S Kings River Rd
- 1374 S Enns Ave
- 1966 E August Ave
- 17689 E Manning Ave
- 1034 Kings Drive Cir
- 996 Kings Drive Cir
- 1021 W Eymann Ave
- 999 W Eymann Ave
- 1021 Kings Drive Cir
- 1053 W Eymann Ave
- 986 Kings Drive Cir
- 1058 Kings Drive Cir
- 344 S Kings Dr
- 991 Kings Drive Cir
- 1053 Kings Drive Cir
- 1077 W Eymann Ave
- 979 W Eymann Ave
- 955 W Eymann Ave
- 464 S Kings Dr
- 339 S Reed Ave
- 319 S Reed Ave
- 1095 W Eymann Ave
- 446 S Kings Dr
- 379 S Reed Ave