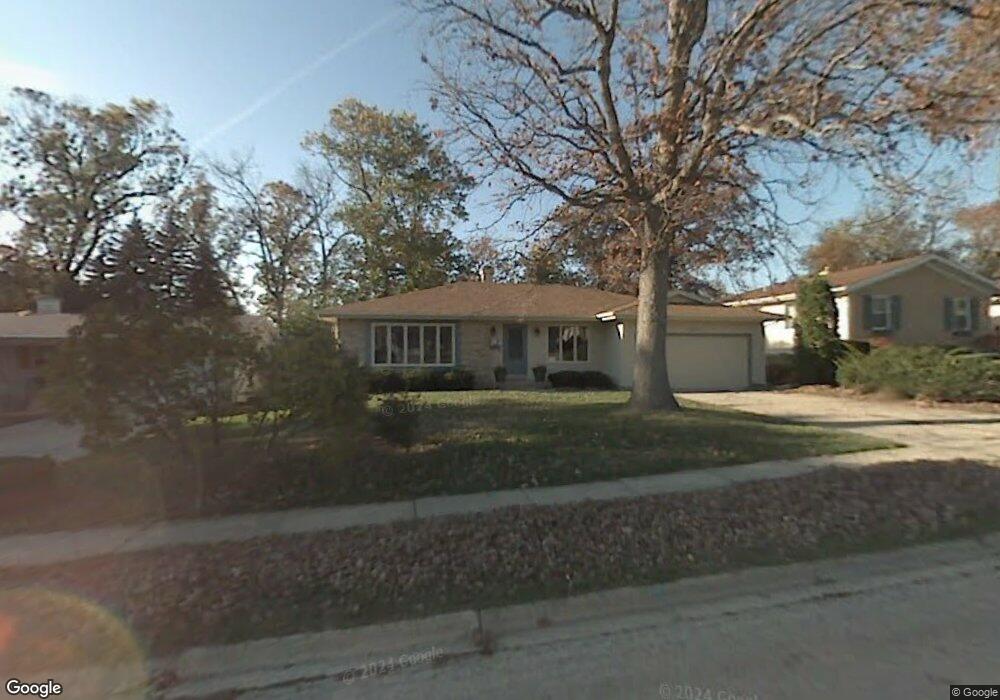
1015 Chesterfield Ct McHenry, IL 60050
Estimated Value: $256,743 - $333,000
--
Bed
--
Bath
1,870
Sq Ft
$163/Sq Ft
Est. Value
About This Home
This home is located at 1015 Chesterfield Ct, McHenry, IL 60050 and is currently estimated at $304,936, approximately $163 per square foot. 1015 Chesterfield Ct is a home located in McHenry County with nearby schools including Riverwood Elementary School, Parkland School, and McHenry Community High School - Upper Campus.
Ownership History
Date
Name
Owned For
Owner Type
Purchase Details
Closed on
Oct 10, 2024
Sold by
Stilling Diane
Bought by
Revocable Living Trust Of Diane L Stilling
Current Estimated Value
Purchase Details
Closed on
Oct 12, 2021
Sold by
Diane Binder Cook Trust
Bought by
Diane Binder Cook Revocable Living Trust
Purchase Details
Closed on
Sep 15, 2004
Sold by
Larsen Marlene K
Bought by
Cook Diane Binder and Diane Binder Cook Trust
Home Financials for this Owner
Home Financials are based on the most recent Mortgage that was taken out on this home.
Original Mortgage
$108,500
Interest Rate
5.95%
Mortgage Type
Stand Alone First
Purchase Details
Closed on
Jun 26, 1998
Sold by
The Ralph M Brown Trust
Bought by
Larsen Marlene K
Purchase Details
Closed on
Mar 11, 1998
Sold by
Brown Ralph M
Bought by
The Ralph M Brown Trust
Create a Home Valuation Report for This Property
The Home Valuation Report is an in-depth analysis detailing your home's value as well as a comparison with similar homes in the area
Home Values in the Area
Average Home Value in this Area
Purchase History
| Date | Buyer | Sale Price | Title Company |
|---|---|---|---|
| Revocable Living Trust Of Diane L Stilling | -- | None Listed On Document | |
| Diane Binder Cook Revocable Living Trust | -- | None Available | |
| Cook Diane Binder | $191,000 | Fatic | |
| Larsen Marlene K | $133,500 | -- | |
| The Ralph M Brown Trust | -- | -- |
Source: Public Records
Mortgage History
| Date | Status | Borrower | Loan Amount |
|---|---|---|---|
| Previous Owner | Cook Diane Binder | $108,500 |
Source: Public Records
Tax History Compared to Growth
Tax History
| Year | Tax Paid | Tax Assessment Tax Assessment Total Assessment is a certain percentage of the fair market value that is determined by local assessors to be the total taxable value of land and additions on the property. | Land | Improvement |
|---|---|---|---|---|
| 2024 | $5,450 | $80,422 | $11,519 | $68,903 |
| 2023 | $5,178 | $72,050 | $10,320 | $61,730 |
| 2022 | $5,305 | $66,843 | $9,574 | $57,269 |
| 2021 | $5,014 | $62,249 | $8,916 | $53,333 |
| 2020 | $4,818 | $59,654 | $8,544 | $51,110 |
| 2019 | $5,163 | $61,065 | $8,133 | $52,932 |
| 2018 | $1,630 | $25,222 | $7,764 | $17,458 |
| 2017 | $2,549 | $32,596 | $7,287 | $25,309 |
| 2016 | $4,224 | $45,352 | $6,810 | $38,542 |
| 2013 | -- | $40,051 | $6,705 | $33,346 |
Source: Public Records
Map
Nearby Homes
- 4602 W Northfox Ln Unit 7
- 915 Royal Dr Unit 2
- 4618 W Northfox Ln Unit 6
- 4718 W Cumberland Cir
- 4604 Sussex Dr
- 4621 Bonner Dr
- 1320 Meadow Ln
- 4913 W Oakwood Dr Unit B
- 4517 Home Ave
- 1514 N North Ave
- 607 Silbury Ct
- 1607 Lakeland Ave
- 5101 W Elm St
- 4507 Ponca St
- 4910 Willow Ln
- 5107 Willow Ln Unit 3
- 3012 Justen Ln
- 5014 Willow Ln
- 926 Front St
- 1807 Beach Rd
- 1013 Chesterfield Ct
- 1017 Chesterfield Ct
- 4726 Ashley Dr
- 4802 Ashley Dr
- 4724 Ashley Dr
- 1019 Chesterfield Ct
- 4712 Chesterfield Dr
- 1014 Chesterfield Ct
- 4708 Chesterfield Dr
- 4722 Ashley Dr
- 1016 Chesterfield Ct
- 4716 Chesterfield Dr
- 1018 Chesterfield Ct
- 4720 Ashley Dr
- 1021 Chesterfield Ct
- 4704 Chesterfield Dr
- 4725 Ashley Dr
- 4709 Chesterfield Dr
- 4718 Ashley Dr
- 4622 Front Royal Dr