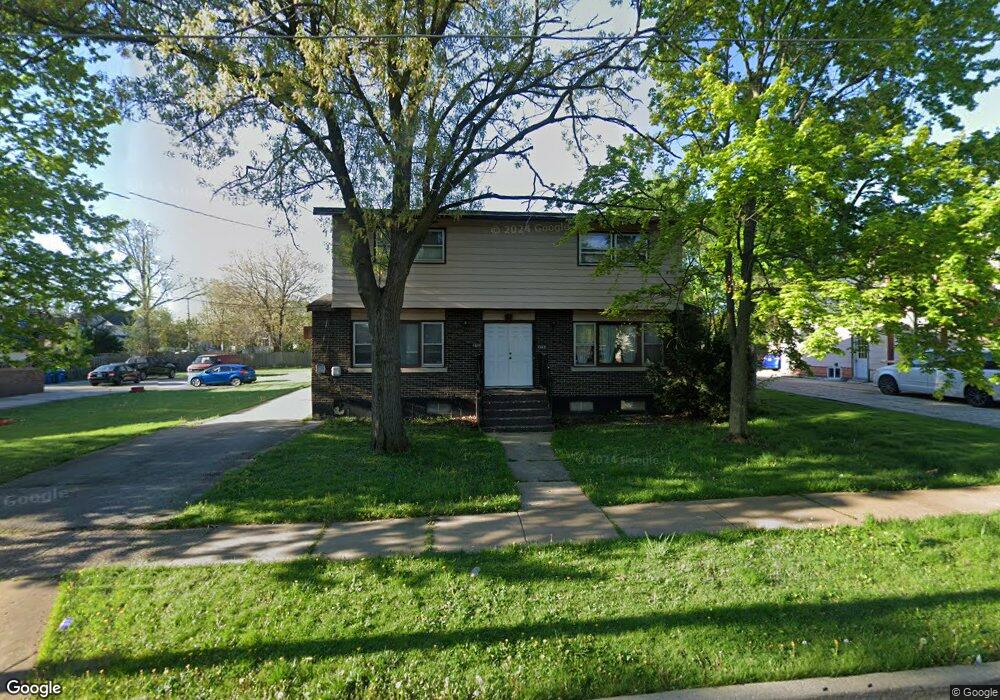
1015 Front St Unit 17 Aurora, IL 60505
Light of the Community NeighborhoodEstimated Value: $273,000 - $374,000
4
Beds
4
Baths
2,086
Sq Ft
$153/Sq Ft
Est. Value
About This Home
This home is located at 1015 Front St Unit 17, Aurora, IL 60505 and is currently estimated at $319,472, approximately $153 per square foot. 1015 Front St Unit 17 is a home located in Kane County with nearby schools including Oak Park Elementary School, Henry W Cowherd Middle School, and East Aurora High School.
Ownership History
Date
Name
Owned For
Owner Type
Purchase Details
Closed on
Apr 22, 2025
Sold by
Moore William K
Bought by
Moore Family Trust and Moore
Current Estimated Value
Purchase Details
Closed on
Jul 2, 2010
Sold by
Fifth Third Bank Na
Bought by
Moore William Kevin
Home Financials for this Owner
Home Financials are based on the most recent Mortgage that was taken out on this home.
Original Mortgage
$60,000
Interest Rate
4.54%
Mortgage Type
New Conventional
Create a Home Valuation Report for This Property
The Home Valuation Report is an in-depth analysis detailing your home's value as well as a comparison with similar homes in the area
Home Values in the Area
Average Home Value in this Area
Purchase History
| Date | Buyer | Sale Price | Title Company |
|---|---|---|---|
| Moore Family Trust | -- | None Listed On Document | |
| Moore William Kevin | $80,000 | Chicago Title Insurance Co |
Source: Public Records
Mortgage History
| Date | Status | Borrower | Loan Amount |
|---|---|---|---|
| Previous Owner | Moore William Kevin | $60,000 |
Source: Public Records
Tax History
| Year | Tax Paid | Tax Assessment Tax Assessment Total Assessment is a certain percentage of the fair market value that is determined by local assessors to be the total taxable value of land and additions on the property. | Land | Improvement |
|---|---|---|---|---|
| 2024 | $6,976 | $101,757 | $8,589 | $93,168 |
| 2023 | $6,710 | $89,787 | $7,674 | $82,113 |
| 2022 | $6,189 | $81,461 | $7,002 | $74,459 |
| 2021 | $6,123 | $75,841 | $6,519 | $69,322 |
| 2020 | $5,858 | $70,445 | $6,055 | $64,390 |
| 2019 | $6,485 | $73,591 | $5,610 | $67,981 |
| 2018 | $5,996 | $65,851 | $5,189 | $60,662 |
| 2017 | $5,744 | $58,576 | $4,781 | $53,795 |
| 2016 | $5,462 | $51,902 | $4,098 | $47,804 |
| 2015 | -- | $45,271 | $3,524 | $41,747 |
| 2014 | -- | $43,390 | $3,239 | $40,151 |
| 2013 | -- | $47,241 | $3,095 | $44,146 |
Source: Public Records
Map
Nearby Homes
Your Personal Tour Guide
Ask me questions while you tour the home.