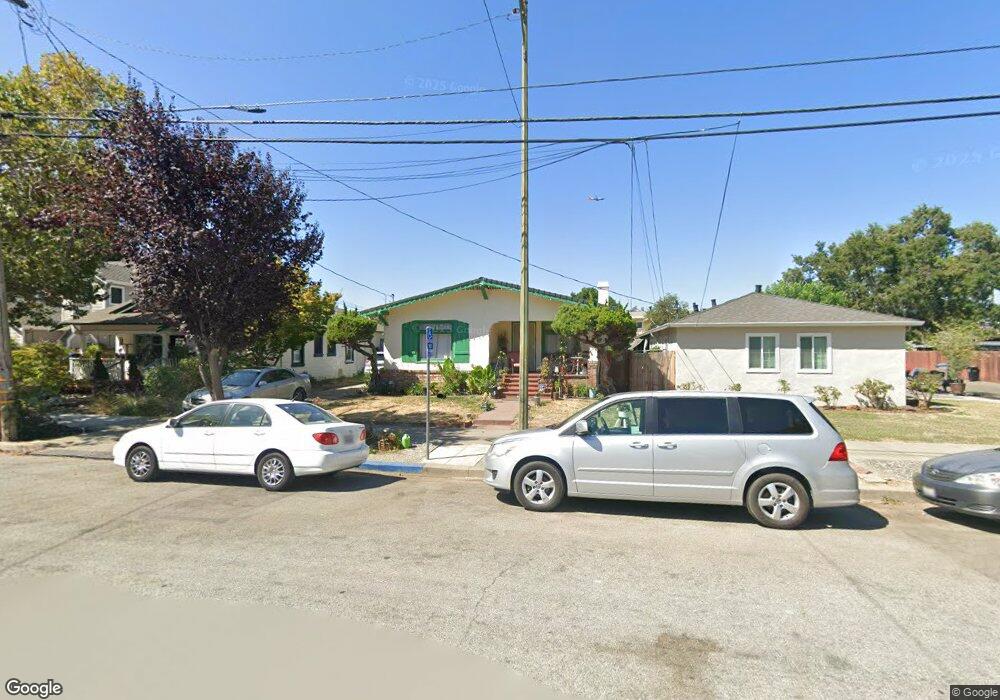
1015 S 8th St San Jose, CA 95112
Spartan-Keyes NeighborhoodEstimated Value: $842,000 - $997,000
2
Beds
1
Bath
1,110
Sq Ft
$834/Sq Ft
Est. Value
About This Home
This home is located at 1015 S 8th St, San Jose, CA 95112 and is currently estimated at $926,097, approximately $834 per square foot. 1015 S 8th St is a home located in Santa Clara County with nearby schools including Lowell Elementary School, Herbert Hoover Middle School, and Abraham Lincoln High.
Ownership History
Date
Name
Owned For
Owner Type
Purchase Details
Closed on
May 26, 2021
Sold by
Castro Maria Teresa
Bought by
Castro Maria Teresa and The Maria Teresa Castro Living
Current Estimated Value
Purchase Details
Closed on
Jan 24, 2000
Sold by
Castro Maria T
Bought by
Castro Miguel and Castro Maria Teresa
Home Financials for this Owner
Home Financials are based on the most recent Mortgage that was taken out on this home.
Original Mortgage
$190,000
Outstanding Balance
$60,913
Interest Rate
7.96%
Estimated Equity
$865,184
Purchase Details
Closed on
Mar 12, 1999
Sold by
Castro Maria Teresa and Rangel Juan Antonio
Bought by
Castro Maria Teresa
Purchase Details
Closed on
Nov 22, 1995
Sold by
Boselly Robert W and Boselly Jenni M
Bought by
Castro Maria Teresa and Rangel Juan Antonio
Home Financials for this Owner
Home Financials are based on the most recent Mortgage that was taken out on this home.
Original Mortgage
$145,500
Interest Rate
7.47%
Create a Home Valuation Report for This Property
The Home Valuation Report is an in-depth analysis detailing your home's value as well as a comparison with similar homes in the area
Home Values in the Area
Average Home Value in this Area
Purchase History
| Date | Buyer | Sale Price | Title Company |
|---|---|---|---|
| Castro Maria Teresa | -- | None Available | |
| Castro Miguel | -- | Financial Title Company | |
| Castro Maria Teresa | -- | Financial Title Company | |
| Castro Maria Teresa | -- | -- | |
| Castro Maria Teresa | $150,000 | First American Title Guarant |
Source: Public Records
Mortgage History
| Date | Status | Borrower | Loan Amount |
|---|---|---|---|
| Open | Castro Miguel | $190,000 | |
| Previous Owner | Castro Maria Teresa | $145,500 |
Source: Public Records
Tax History Compared to Growth
Tax History
| Year | Tax Paid | Tax Assessment Tax Assessment Total Assessment is a certain percentage of the fair market value that is determined by local assessors to be the total taxable value of land and additions on the property. | Land | Improvement |
|---|---|---|---|---|
| 2025 | $5,032 | $249,156 | $157,804 | $91,352 |
| 2024 | $5,032 | $244,271 | $154,710 | $89,561 |
| 2023 | $4,890 | $239,482 | $151,677 | $87,805 |
| 2022 | $4,830 | $234,787 | $148,703 | $86,084 |
| 2021 | $4,570 | $230,185 | $145,788 | $84,397 |
| 2020 | $3,889 | $227,826 | $144,294 | $83,532 |
| 2019 | $3,784 | $223,360 | $141,465 | $81,895 |
| 2018 | $3,726 | $218,982 | $138,692 | $80,290 |
| 2017 | $3,682 | $214,689 | $135,973 | $78,716 |
| 2016 | $3,537 | $210,480 | $133,307 | $77,173 |
| 2015 | $3,500 | $207,319 | $131,305 | $76,014 |
| 2014 | $3,077 | $203,258 | $128,733 | $74,525 |
Source: Public Records
Map
Nearby Homes
- 961 S 7th St
- 327 Martha St
- 962 S 10th St
- 1144 S 9th St
- 1192 S 9th St
- 952 S 11th St Unit 234
- 516 Martha St Unit 101
- 516 Martha St Unit 201
- 951 S 12th St Unit 102
- 1060 S 3rd St Unit 129
- 1060 S 3rd St Unit 216
- 1060 S 3rd St Unit 379
- 1060 S 3rd St Unit 179
- 1060 S 3rd St Unit 344
- 1060 S 3rd St Unit 233
- 114 Hollywood Ave
- 82 Hollywood Ave
- 125 Patterson St Unit 334
- 125 Patterson St Unit 121
- 648 Valley Oak Terrace
- 1019 S 8th St
- 1005 S 8th St
- 1027 S 8th St
- 1010 S 7th St
- 1033 S 8th St
- 995 S 8th St Unit Back Unit
- 995 S 8th St
- 1000 S 7th St
- 1020 S 7th St
- 994 S 7th St
- 1026 S 7th St
- 1045 S 8th St
- 985 S 8th St
- 996 S 7th St Unit Ground Fl
- 996 S 7th St
- 1036 S 7th St
- 1016 S 8th St
- 990 S 7th St
- 1020 S 8th St
- 1004 S 8th St