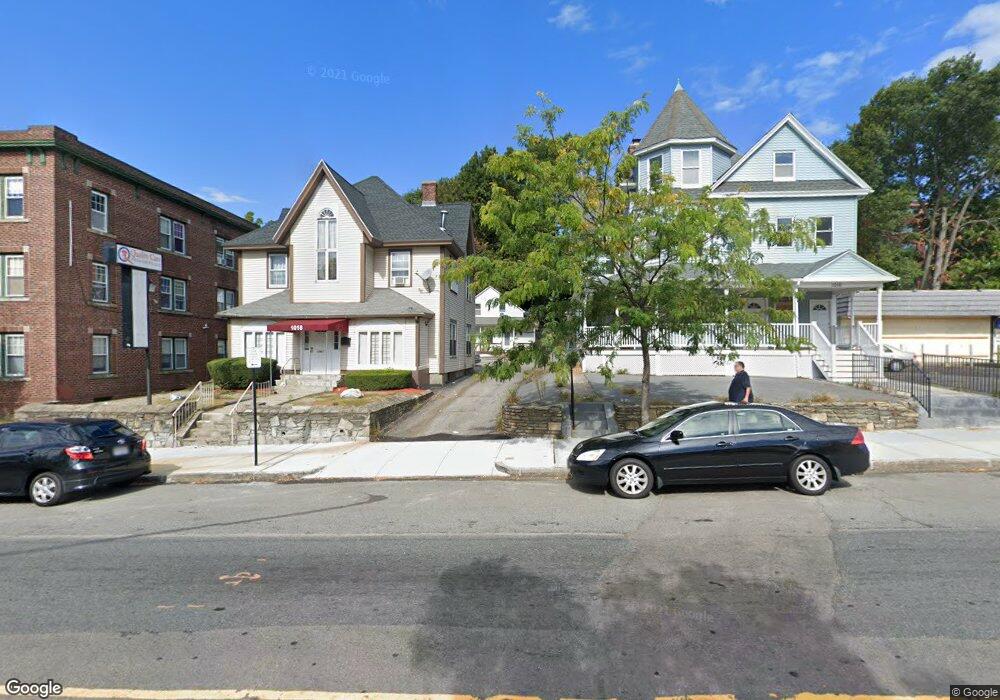
1016 1/2 Main St Worcester, MA 01603
University Park NeighborhoodEstimated Value: $299,000 - $473,000
3
Beds
1
Bath
840
Sq Ft
$438/Sq Ft
Est. Value
About This Home
This home is located at 1016 1/2 Main St, Worcester, MA 01603 and is currently estimated at $368,084, approximately $438 per square foot. 1016 1/2 Main St is a home located in Worcester County with nearby schools including Goddard School of Science & Technology, Jacob Hiatt Magnet School, and Chandler Magnet.
Ownership History
Date
Name
Owned For
Owner Type
Purchase Details
Closed on
Jan 24, 2012
Sold by
Nguyen Elizabeth and Doan Duke N
Bought by
Ngo Timothy and Ngo Emily
Current Estimated Value
Purchase Details
Closed on
May 25, 1999
Sold by
Wheeler Bruce and Wheeler Amy
Bought by
Doan Duke N
Home Financials for this Owner
Home Financials are based on the most recent Mortgage that was taken out on this home.
Original Mortgage
$52,000
Interest Rate
6.88%
Mortgage Type
Purchase Money Mortgage
Create a Home Valuation Report for This Property
The Home Valuation Report is an in-depth analysis detailing your home's value as well as a comparison with similar homes in the area
Home Values in the Area
Average Home Value in this Area
Purchase History
| Date | Buyer | Sale Price | Title Company |
|---|---|---|---|
| Ngo Timothy | $70,000 | -- | |
| Doan Duke N | $52,000 | -- |
Source: Public Records
Mortgage History
| Date | Status | Borrower | Loan Amount |
|---|---|---|---|
| Previous Owner | Doan Duke N | $52,000 |
Source: Public Records
Tax History Compared to Growth
Tax History
| Year | Tax Paid | Tax Assessment Tax Assessment Total Assessment is a certain percentage of the fair market value that is determined by local assessors to be the total taxable value of land and additions on the property. | Land | Improvement |
|---|---|---|---|---|
| 2025 | $3,195 | $242,200 | $72,900 | $169,300 |
| 2024 | $3,062 | $222,700 | $72,900 | $149,800 |
| 2023 | $2,943 | $205,200 | $63,400 | $141,800 |
| 2022 | $2,713 | $178,400 | $50,700 | $127,700 |
| 2021 | $2,523 | $155,000 | $40,600 | $114,400 |
| 2020 | $2,613 | $153,700 | $40,300 | $113,400 |
| 2019 | $2,493 | $138,500 | $35,200 | $103,300 |
| 2018 | $1,696 | $89,700 | $35,200 | $54,500 |
| 2017 | $1,614 | $84,000 | $35,200 | $48,800 |
| 2016 | $1,579 | $76,600 | $25,800 | $50,800 |
| 2015 | $1,537 | $76,600 | $25,800 | $50,800 |
| 2014 | $1,497 | $76,600 | $25,800 | $50,800 |
Source: Public Records
Map
Nearby Homes