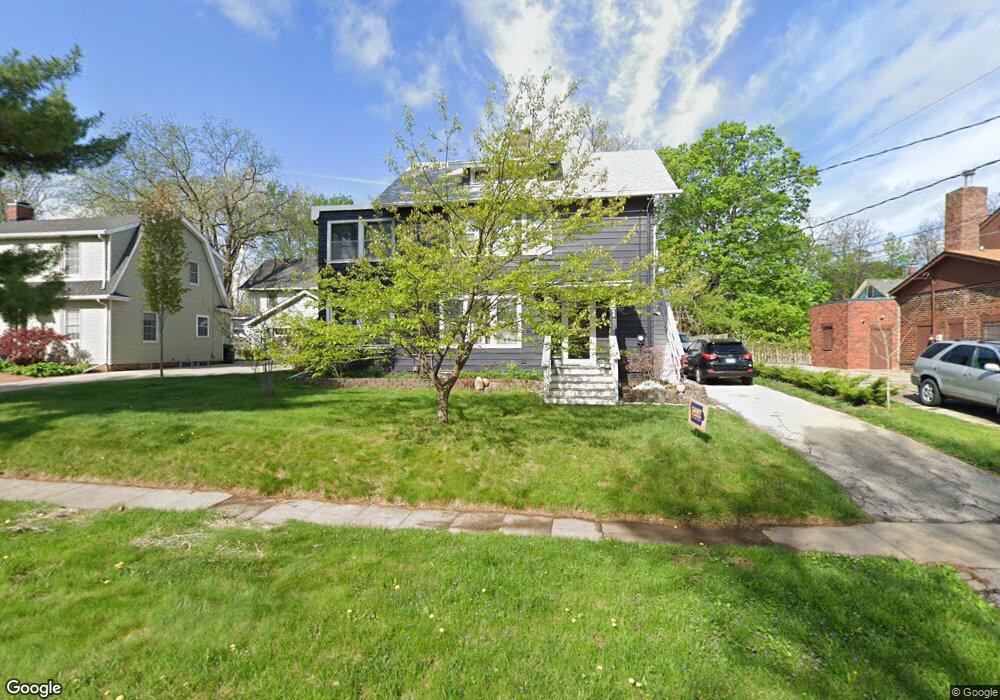
1016 29th St Des Moines, IA 50311
Drake NeighborhoodEstimated Value: $246,000 - $281,000
2
Beds
2
Baths
1,848
Sq Ft
$141/Sq Ft
Est. Value
About This Home
This home is located at 1016 29th St, Des Moines, IA 50311 and is currently estimated at $260,199, approximately $140 per square foot. 1016 29th St is a home located in Polk County with nearby schools including Hubbell Elementary, Callanan Middle School, and Roosevelt High School.
Ownership History
Date
Name
Owned For
Owner Type
Purchase Details
Closed on
Nov 30, 2021
Sold by
Riley Jean M
Bought by
Riley Jean M and Jean M Riley Revocable Trust
Current Estimated Value
Purchase Details
Closed on
Nov 19, 2007
Sold by
Fisher Hank
Bought by
Riley Jean M
Purchase Details
Closed on
Apr 18, 1999
Sold by
Martin Angel S and Martin Connie
Bought by
Riley Jean M
Home Financials for this Owner
Home Financials are based on the most recent Mortgage that was taken out on this home.
Original Mortgage
$68,700
Interest Rate
7.1%
Purchase Details
Closed on
Jun 16, 1998
Sold by
Martin Christian E and Martin Melissa
Bought by
Martin Angel S
Create a Home Valuation Report for This Property
The Home Valuation Report is an in-depth analysis detailing your home's value as well as a comparison with similar homes in the area
Home Values in the Area
Average Home Value in this Area
Purchase History
| Date | Buyer | Sale Price | Title Company |
|---|---|---|---|
| Riley Jean M | -- | None Available | |
| Riley Jean M | -- | None Available | |
| Riley Jean M | $66,000 | -- | |
| Martin Angel S | -- | -- |
Source: Public Records
Mortgage History
| Date | Status | Borrower | Loan Amount |
|---|---|---|---|
| Previous Owner | Riley Jean M | $68,700 | |
| Closed | Riley Jean M | $8,830 |
Source: Public Records
Tax History
| Year | Tax Paid | Tax Assessment Tax Assessment Total Assessment is a certain percentage of the fair market value that is determined by local assessors to be the total taxable value of land and additions on the property. | Land | Improvement |
|---|---|---|---|---|
| 2025 | $3,628 | $233,700 | $25,000 | $208,700 |
| 2024 | $3,628 | $194,860 | $21,600 | $173,260 |
| 2023 | $3,270 | $202,800 | $21,600 | $181,200 |
| 2022 | $3,244 | $155,600 | $17,400 | $138,200 |
| 2021 | $2,996 | $155,600 | $17,400 | $138,200 |
| 2020 | $3,108 | $136,600 | $15,400 | $121,200 |
| 2019 | $3,138 | $136,600 | $15,400 | $121,200 |
| 2018 | $3,100 | $133,200 | $11,300 | $121,900 |
| 2017 | $2,824 | $133,200 | $11,300 | $121,900 |
| 2016 | $2,956 | $120,900 | $10,200 | $110,700 |
| 2015 | $2,956 | $120,900 | $10,200 | $110,700 |
| 2014 | $2,586 | $109,900 | $11,000 | $98,900 |
Source: Public Records
Map
Nearby Homes
Your Personal Tour Guide
Ask me questions while you tour the home.