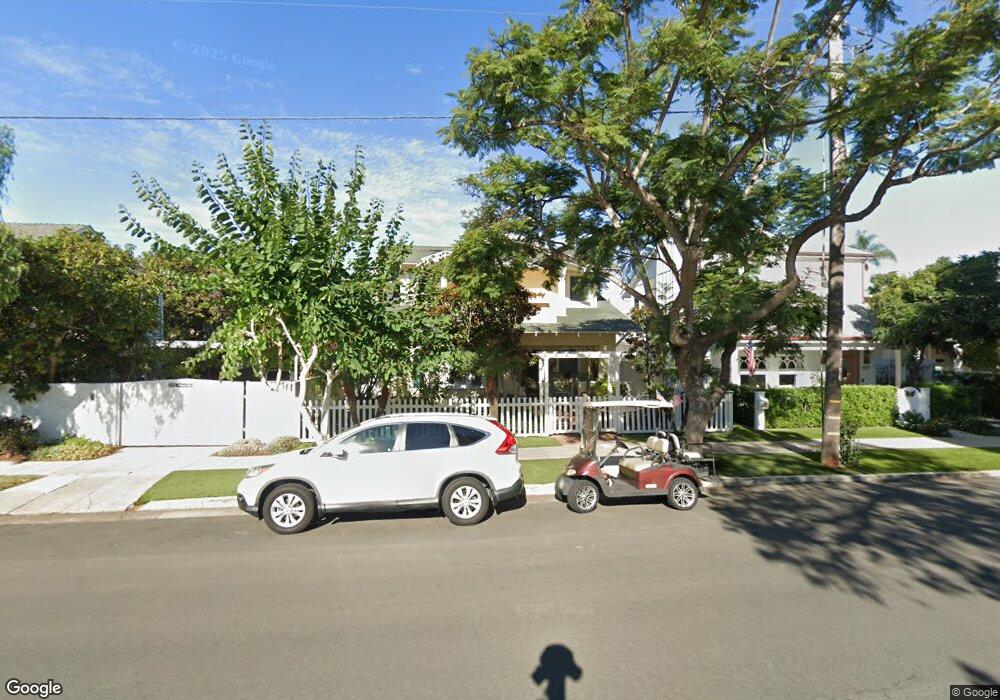
1016 F Ave Coronado, CA 92118
Estimated Value: $3,154,192 - $4,004,000
3
Beds
4
Baths
1,967
Sq Ft
$1,861/Sq Ft
Est. Value
About This Home
This home is located at 1016 F Ave, Coronado, CA 92118 and is currently estimated at $3,661,298, approximately $1,861 per square foot. 1016 F Ave is a home located in San Diego County with nearby schools including Coronado Village Elementary, Coronado Middle School, and Coronado High School.
Ownership History
Date
Name
Owned For
Owner Type
Purchase Details
Closed on
Feb 12, 2021
Sold by
Zanoni Richard E and Zanoni Patricia
Bought by
Zanoni Nicholas Christian and Richard & Patricia Zanoni 1016
Current Estimated Value
Purchase Details
Closed on
Mar 29, 2000
Sold by
Gelm John R and Gelm Jill M
Bought by
Zanoni Richard E and Zanoni Patricia
Home Financials for this Owner
Home Financials are based on the most recent Mortgage that was taken out on this home.
Original Mortgage
$480,000
Outstanding Balance
$112,957
Interest Rate
3.82%
Estimated Equity
$3,548,341
Purchase Details
Closed on
Oct 5, 1994
Sold by
Milligan Donald F
Bought by
Gelm John R and Gelm Jill M
Home Financials for this Owner
Home Financials are based on the most recent Mortgage that was taken out on this home.
Original Mortgage
$347,700
Interest Rate
3.95%
Create a Home Valuation Report for This Property
The Home Valuation Report is an in-depth analysis detailing your home's value as well as a comparison with similar homes in the area
Home Values in the Area
Average Home Value in this Area
Purchase History
| Date | Buyer | Sale Price | Title Company |
|---|---|---|---|
| Zanoni Nicholas Christian | -- | None Available | |
| Zanoni Richard E | $600,000 | Chicago Title Co | |
| Gelm John R | $366,000 | Union Land Title Co |
Source: Public Records
Mortgage History
| Date | Status | Borrower | Loan Amount |
|---|---|---|---|
| Open | Zanoni Richard E | $480,000 | |
| Previous Owner | Gelm John R | $347,700 |
Source: Public Records
Tax History Compared to Growth
Tax History
| Year | Tax Paid | Tax Assessment Tax Assessment Total Assessment is a certain percentage of the fair market value that is determined by local assessors to be the total taxable value of land and additions on the property. | Land | Improvement |
|---|---|---|---|---|
| 2025 | $11,688 | $1,073,917 | $614,786 | $459,131 |
| 2024 | $11,688 | $1,052,861 | $602,732 | $450,129 |
| 2023 | $11,505 | $1,032,217 | $590,914 | $441,303 |
| 2022 | $11,292 | $1,011,978 | $579,328 | $432,650 |
| 2021 | $11,055 | $992,136 | $567,969 | $424,167 |
| 2020 | $10,752 | $981,964 | $562,146 | $419,818 |
| 2019 | $10,716 | $962,711 | $551,124 | $411,587 |
| 2018 | $10,536 | $943,835 | $540,318 | $403,517 |
| 2017 | $10,330 | $925,329 | $529,724 | $395,605 |
| 2016 | $10,000 | $907,187 | $519,338 | $387,849 |
| 2015 | $9,827 | $893,562 | $511,538 | $382,024 |
| 2014 | $9,574 | $876,059 | $501,518 | $374,541 |
Source: Public Records
Map
Nearby Homes