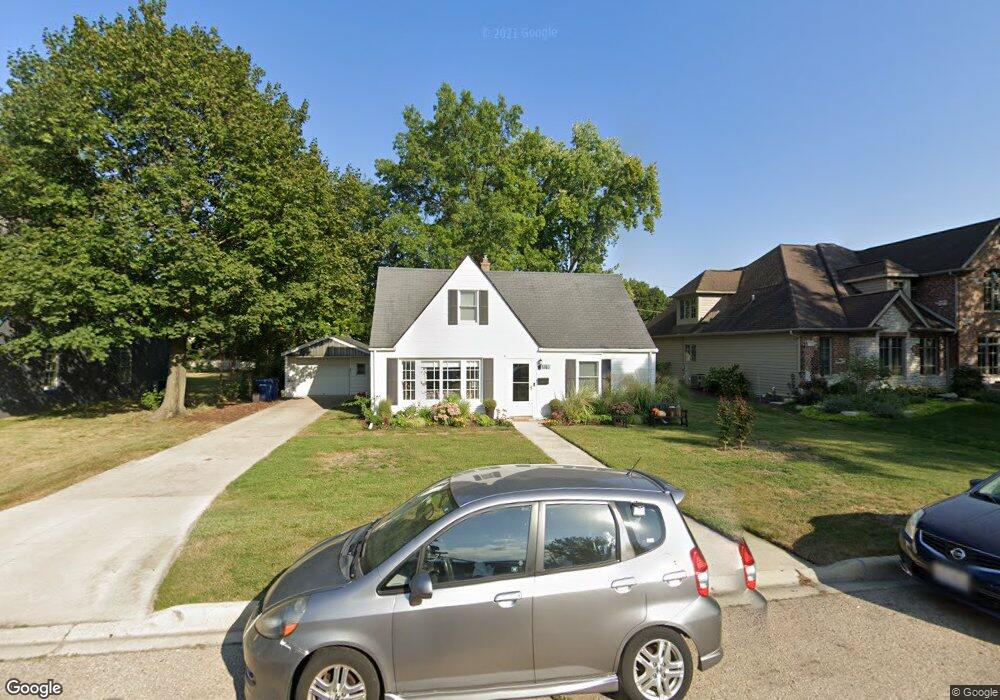
1016 S 5th St Saint Charles, IL 60174
Southwest Saint Charles NeighborhoodEstimated Value: $323,000 - $479,000
4
Beds
3
Baths
1,938
Sq Ft
$214/Sq Ft
Est. Value
About This Home
This home is located at 1016 S 5th St, Saint Charles, IL 60174 and is currently estimated at $415,687, approximately $214 per square foot. 1016 S 5th St is a home located in Kane County with nearby schools including Davis Primary School, Richmond Intermediate School, and Thompson Middle School.
Ownership History
Date
Name
Owned For
Owner Type
Purchase Details
Closed on
Jul 1, 2016
Sold by
Margulies Patricia S
Bought by
Mccutcheon Mark A and Mccutcheon Colleen J
Current Estimated Value
Home Financials for this Owner
Home Financials are based on the most recent Mortgage that was taken out on this home.
Original Mortgage
$148,800
Outstanding Balance
$118,698
Interest Rate
3.64%
Mortgage Type
New Conventional
Estimated Equity
$296,989
Purchase Details
Closed on
Dec 31, 2012
Sold by
Margulies Frederic
Bought by
Irr Margulies Patricia S and Irr Frederick J Margulies 2012
Purchase Details
Closed on
Mar 5, 2012
Sold by
Marshall John D and Marshall Roger G
Bought by
Margulies Fred
Purchase Details
Closed on
Jul 1, 2011
Sold by
Marshall John D and William G Marshall Trust
Bought by
Marshall John D and Marshall Roger G
Purchase Details
Closed on
Sep 9, 1999
Sold by
Marshall Reita A
Bought by
Marshall Reita A and Reita A Marshall Living Trust
Create a Home Valuation Report for This Property
The Home Valuation Report is an in-depth analysis detailing your home's value as well as a comparison with similar homes in the area
Home Values in the Area
Average Home Value in this Area
Purchase History
| Date | Buyer | Sale Price | Title Company |
|---|---|---|---|
| Mccutcheon Mark A | $186,000 | None Available | |
| Irr Margulies Patricia S | -- | None Available | |
| Margulies Fred | -- | Atg | |
| Marshall John D | -- | None Available | |
| Marshall John D | -- | None Available | |
| Marshall Reita A | -- | -- | |
| Marshall William G | -- | -- |
Source: Public Records
Mortgage History
| Date | Status | Borrower | Loan Amount |
|---|---|---|---|
| Open | Mccutcheon Mark A | $148,800 |
Source: Public Records
Tax History Compared to Growth
Tax History
| Year | Tax Paid | Tax Assessment Tax Assessment Total Assessment is a certain percentage of the fair market value that is determined by local assessors to be the total taxable value of land and additions on the property. | Land | Improvement |
|---|---|---|---|---|
| 2024 | $8,158 | $109,898 | $37,240 | $72,658 |
| 2023 | $7,872 | $98,360 | $33,330 | $65,030 |
| 2022 | $7,391 | $91,535 | $32,835 | $58,700 |
| 2021 | $7,116 | $87,251 | $31,298 | $55,953 |
| 2020 | $7,047 | $85,624 | $30,714 | $54,910 |
| 2019 | $6,927 | $83,929 | $30,106 | $53,823 |
| 2018 | $6,576 | $79,279 | $27,334 | $51,945 |
| 2017 | $6,416 | $76,568 | $26,399 | $50,169 |
| 2016 | $6,749 | $73,879 | $25,472 | $48,407 |
| 2015 | -- | $69,930 | $25,197 | $44,733 |
| 2014 | -- | $66,496 | $25,197 | $41,299 |
| 2013 | -- | $67,386 | $25,449 | $41,937 |
Source: Public Records
Map
Nearby Homes
- 1028 S 5th St
- 1326 Elm St
- 885 Geneva Rd
- 806 Fellows St
- 1008 Pine St
- Lot 1 Keller Place
- 82 Gray St
- Lot 2 Geneva Rd
- Lot 1 Geneva Rd
- 629 N Lincoln Ave
- 1108 S 12th St Unit 2
- 311 Ohio Ave
- 50 S 1st St Unit 5D
- 2749 Stone Cir
- 2753 Stone Cir
- 2747 Stone Cir
- 2751 Stone Cir
- 1330-1332 S 14th St
- 1336-1338 S 14th St
- 602 Highbury Ln