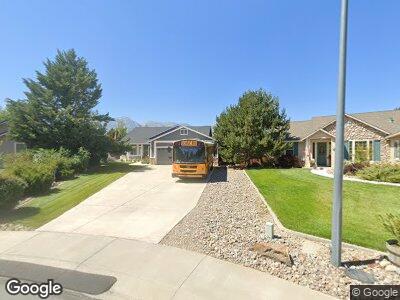
1016 Sierra Vista Ct Gardnerville, NV 89460
Estimated Value: $617,000 - $707,000
3
Beds
2
Baths
1,801
Sq Ft
$369/Sq Ft
Est. Value
About This Home
This home is located at 1016 Sierra Vista Ct, Gardnerville, NV 89460 and is currently estimated at $665,257, approximately $369 per square foot. 1016 Sierra Vista Ct is a home located in Douglas County with nearby schools including C.C. Meneley Elementary School, Pau Wa Lu Middle School, and Douglas County High School.
Ownership History
Date
Name
Owned For
Owner Type
Purchase Details
Closed on
May 21, 2018
Sold by
Lampkin Larry H and Lampkin Rachel E
Bought by
Lampkin Larry H and Lampkin Rachel E
Current Estimated Value
Home Financials for this Owner
Home Financials are based on the most recent Mortgage that was taken out on this home.
Original Mortgage
$340,862
Interest Rate
4.62%
Mortgage Type
FHA
Purchase Details
Closed on
Apr 28, 2006
Sold by
Lampkin Larry H and Lampkin Rachel E
Bought by
Lampkin Larry H and Lampkin Rachel E
Home Financials for this Owner
Home Financials are based on the most recent Mortgage that was taken out on this home.
Original Mortgage
$321,500
Interest Rate
6.3%
Mortgage Type
Stand Alone Refi Refinance Of Original Loan
Create a Home Valuation Report for This Property
The Home Valuation Report is an in-depth analysis detailing your home's value as well as a comparison with similar homes in the area
Home Values in the Area
Average Home Value in this Area
Purchase History
| Date | Buyer | Sale Price | Title Company |
|---|---|---|---|
| Lampkin Larry H | -- | First American Title Ins Co | |
| Lampkin Larry H | -- | None Available |
Source: Public Records
Mortgage History
| Date | Status | Borrower | Loan Amount |
|---|---|---|---|
| Closed | Lampkin Larry H | $405,500 | |
| Closed | Lampkin Larry H | $354,000 | |
| Closed | Lampkin Larry H | $343,500 | |
| Closed | Lampkin Larry H | $340,862 | |
| Closed | Lampkin Larry H | $320,512 | |
| Closed | Lampkin Larry H | $314,110 | |
| Closed | Lampkin Larry H | $321,500 |
Source: Public Records
Tax History Compared to Growth
Tax History
| Year | Tax Paid | Tax Assessment Tax Assessment Total Assessment is a certain percentage of the fair market value that is determined by local assessors to be the total taxable value of land and additions on the property. | Land | Improvement |
|---|---|---|---|---|
| 2025 | $2,971 | $118,795 | $40,250 | $78,545 |
| 2024 | $2,885 | $119,512 | $40,250 | $79,262 |
| 2023 | $2,885 | $114,886 | $40,250 | $74,636 |
| 2022 | $2,801 | $105,634 | $35,000 | $70,634 |
| 2021 | $2,719 | $98,697 | $31,500 | $67,197 |
| 2020 | $2,640 | $97,848 | $31,500 | $66,348 |
| 2019 | $2,563 | $93,280 | $28,000 | $65,280 |
| 2018 | $2,488 | $87,442 | $24,500 | $62,942 |
| 2017 | $2,416 | $86,426 | $22,750 | $63,676 |
| 2016 | $2,355 | $84,931 | $21,000 | $63,931 |
| 2015 | $2,350 | $84,931 | $21,000 | $63,931 |
| 2014 | $2,281 | $75,231 | $21,000 | $54,231 |
Source: Public Records
Map
Nearby Homes
- 1208 Pleasantview Dr
- 971 Fieldgate Way
- 972 Springfield Dr
- 1026 Sun Crest Ct
- 1023 Sun Crest Ct
- 911 Holstein Ct
- 1094 Rocky Terrace
- 692 Sage Grouse Loop
- 620 Sage Grouse Loop
- 698 Sage Grouse Loop
- 686 Sage Grouse Loop Unit Lot 4
- 1178 Woodford Ln
- 1178 Woodfords Ln
- 918 Springfield Dr
- 1179 Woodfords Ln
- 626 Sage Grouse Loop Unit 14
- 638 Sage Grouse Loop
- 1008 Keystone Ct
- 950 Heavenly View Ct
- 1058 Aspen Brook Ln
- 1016 Sierra Vista Ct
- 1014 Sierra Vista Ct
- 1018 Sierra Vista Ct
- 1200 Pleasantview Dr
- 1204 Pleasantview Dr
- 1020 Sierra Vista Ct
- 1181 Chisholm Trail
- 1015 Sierra Vista Ct
- 1185 Chisholm Trail
- 1017 Sierra Vista Ct
- 1021 Sierra Vista Ct
- 1022 Sierra Vista Ct
- 1189 Chisholm Trail
- 1212 Pleasantview Dr
- 994 Springfield Dr Unit Springfield
- 1177 Chisholm Trail
- 993 Springfield Dr
- 1209 Pleasantview Dr
- 987 Old Nevada Way
- 1221 Sierra Vista Dr