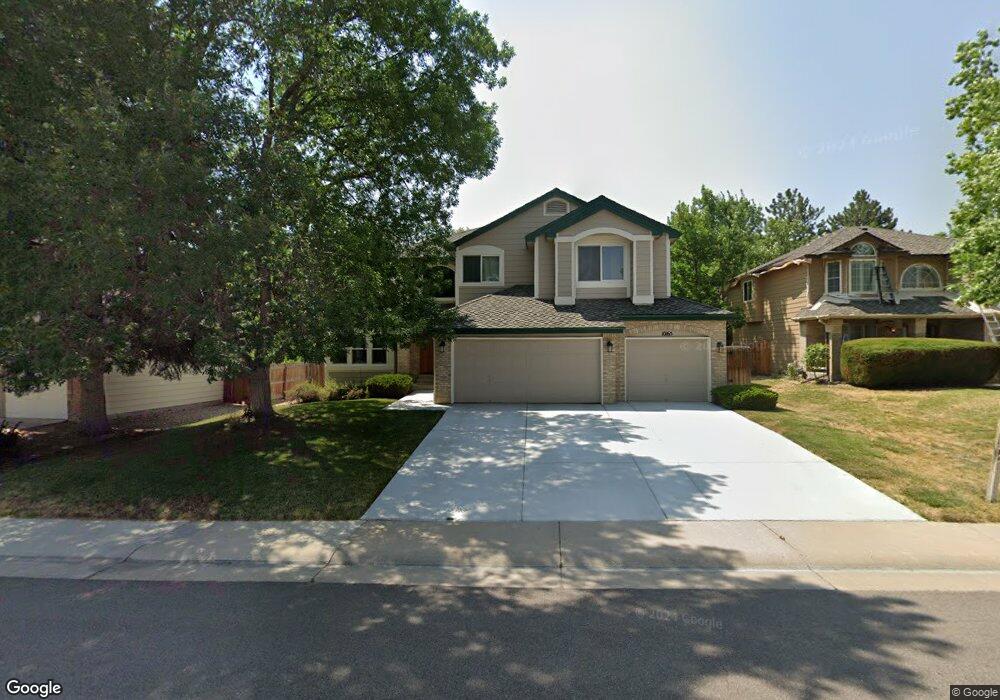
10165 Stoneridge Terrace Parker, CO 80134
Stonegate NeighborhoodEstimated Value: $700,258 - $738,000
4
Beds
4
Baths
2,357
Sq Ft
$304/Sq Ft
Est. Value
About This Home
This home is located at 10165 Stoneridge Terrace, Parker, CO 80134 and is currently estimated at $717,065, approximately $304 per square foot. 10165 Stoneridge Terrace is a home located in Douglas County with nearby schools including Pine Grove Elementary School, Sierra Middle School, and Chaparral High School.
Ownership History
Date
Name
Owned For
Owner Type
Purchase Details
Closed on
Oct 28, 1994
Sold by
Johns Kevin R and Johns Ruth A
Bought by
Anderson Thomas R and Anderson Nina J
Current Estimated Value
Home Financials for this Owner
Home Financials are based on the most recent Mortgage that was taken out on this home.
Original Mortgage
$148,100
Interest Rate
6.12%
Purchase Details
Closed on
Dec 2, 1991
Sold by
Richmond Homes Inc Ii
Bought by
Johns Kevin R and Johns Ruth A
Purchase Details
Closed on
Jun 12, 1991
Sold by
Richmond Homes Inc I
Bought by
Richmond Homes Inc Ii
Purchase Details
Closed on
Dec 28, 1989
Sold by
Richmond Homes Ltd
Bought by
Richmond American Homes Colo Inc Ii
Purchase Details
Closed on
Feb 1, 1987
Sold by
Chanticleer Homes Ii Inc
Bought by
Richmond Homes Ltd
Create a Home Valuation Report for This Property
The Home Valuation Report is an in-depth analysis detailing your home's value as well as a comparison with similar homes in the area
Home Values in the Area
Average Home Value in this Area
Purchase History
| Date | Buyer | Sale Price | Title Company |
|---|---|---|---|
| Anderson Thomas R | $197,500 | North American Title | |
| Johns Kevin R | $165,600 | -- | |
| Richmond Homes Inc Ii | -- | -- | |
| Richmond American Homes Colo Inc Ii | -- | -- | |
| Richmond Homes Ltd | -- | -- |
Source: Public Records
Mortgage History
| Date | Status | Borrower | Loan Amount |
|---|---|---|---|
| Closed | Anderson Thomas R | $148,100 |
Source: Public Records
Tax History Compared to Growth
Tax History
| Year | Tax Paid | Tax Assessment Tax Assessment Total Assessment is a certain percentage of the fair market value that is determined by local assessors to be the total taxable value of land and additions on the property. | Land | Improvement |
|---|---|---|---|---|
| 2024 | $4,316 | $50,680 | $9,960 | $40,720 |
| 2023 | $4,353 | $50,680 | $9,960 | $40,720 |
| 2022 | $3,024 | $34,350 | $6,680 | $27,670 |
| 2021 | $3,111 | $34,350 | $6,680 | $27,670 |
| 2020 | $2,992 | $34,170 | $7,270 | $26,900 |
| 2019 | $2,919 | $34,170 | $7,270 | $26,900 |
| 2018 | $2,405 | $29,170 | $6,580 | $22,590 |
| 2017 | $3,013 | $29,170 | $6,580 | $22,590 |
| 2016 | $2,928 | $27,900 | $5,570 | $22,330 |
| 2015 | $2,984 | $27,900 | $5,570 | $22,330 |
| 2014 | $1,443 | $24,320 | $5,410 | $18,910 |
Source: Public Records
Map
Nearby Homes
- 10158 Stoneridge Terrace
- 10050 Granite Hill Dr
- 10056 Carnelian Place
- 10311 Mica Way
- 16056 Quarry Hill Dr
- 10312 Stoneflower Dr
- 16136 Sequoia Dr
- 10114 Atlanta St
- 15565 Flowerhill Cir
- 15033 Delhi Ave
- 16341 Maple Rock Ct
- 15432 Greenstone Cir
- 15626 Greenstone Cir
- 10397 Helsinki St
- 16382 Maple Rock Ct
- 14969 Elsinore Ave
- 10228 Fort Worth Ct
- 10519 Winterflower Way
- 10530 Winterflower Way
- 16642 Autumn Rock Cove
- 10157 Stoneridge Terrace
- 10173 Stoneridge Terrace
- 10150 Granite Hill Dr
- 10181 Stoneridge Terrace
- 10154 Granite Hill Dr
- 10146 Granite Hill Dr
- 10149 Stoneridge Terrace
- 10166 Stoneridge Terrace
- 10174 Stoneridge Terrace
- 10160 Granite Hill Dr
- 10142 Granite Hill Dr
- 10189 Stoneridge Terrace
- 10141 Stoneridge Terrace
- 10190 Stoneridge Terrace
- 10150 Stoneridge Terrace
- 10172 Granite Hill Dr
- 10138 Granite Hill Dr
- 10142 Stoneridge Terrace
- 10153 Granite Hill Dr
- 15587 Pebblewood Ct