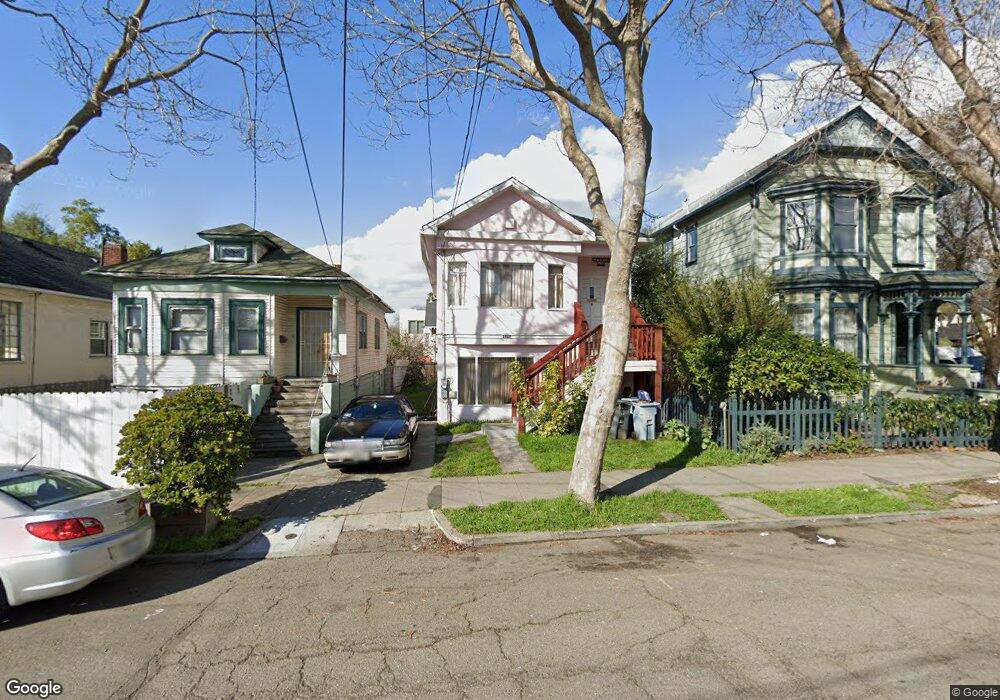
1017 Allston Way Berkeley, CA 94710
West Berkeley NeighborhoodEstimated Value: $973,000 - $1,058,011
3
Beds
2
Baths
1,086
Sq Ft
$948/Sq Ft
Est. Value
About This Home
This home is located at 1017 Allston Way, Berkeley, CA 94710 and is currently estimated at $1,029,253, approximately $947 per square foot. 1017 Allston Way is a home located in Alameda County with nearby schools including Rosa Parks Elementary School, Ruth Acty Elementary, and Berkeley Arts Magnet at Whittier School.
Ownership History
Date
Name
Owned For
Owner Type
Purchase Details
Closed on
Aug 5, 2014
Sold by
Breland Mary
Bought by
Breland Mary C and The Mary C Breland Living Trus
Current Estimated Value
Create a Home Valuation Report for This Property
The Home Valuation Report is an in-depth analysis detailing your home's value as well as a comparison with similar homes in the area
Home Values in the Area
Average Home Value in this Area
Purchase History
| Date | Buyer | Sale Price | Title Company |
|---|---|---|---|
| Breland Mary C | -- | None Available |
Source: Public Records
Tax History
| Year | Tax Paid | Tax Assessment Tax Assessment Total Assessment is a certain percentage of the fair market value that is determined by local assessors to be the total taxable value of land and additions on the property. | Land | Improvement |
|---|---|---|---|---|
| 2025 | $5,855 | $135,523 | $42,471 | $100,052 |
| 2024 | $5,855 | $132,728 | $41,638 | $98,090 |
| 2023 | $5,650 | $136,989 | $40,822 | $96,167 |
| 2022 | $5,637 | $127,304 | $40,022 | $94,282 |
| 2021 | $5,602 | $124,670 | $39,237 | $92,433 |
| 2020 | $5,191 | $130,320 | $38,835 | $91,485 |
| 2019 | $4,846 | $127,765 | $38,073 | $89,692 |
| 2018 | $4,700 | $125,260 | $37,327 | $87,933 |
| 2017 | $4,515 | $122,804 | $36,595 | $86,209 |
| 2016 | $4,241 | $120,397 | $35,878 | $84,519 |
| 2015 | $4,151 | $118,589 | $35,339 | $83,250 |
| 2014 | $4,054 | $116,267 | $34,648 | $81,619 |
Source: Public Records
Map
Nearby Homes
- 1015 Allston Way
- 1019 Allston Way
- 1013 Allston Way
- 2128 10th St
- 1011 Allston Way
- 2124 10th St
- 2124 10th St Unit 2126
- 2126 10th St
- 1009 Allston Way
- 2200 10th St
- 1023 Allston Way
- 2122 10th St
- 1007 Allston Way
- 2129 9th St
- 2204 10th St
- 1014 Allston Way
- 2129 Ninth St
- 1027 Allston Way
- 2125 Ninth St Unit 1
- 2125 Ninth St Unit 2
Your Personal Tour Guide
Ask me questions while you tour the home.