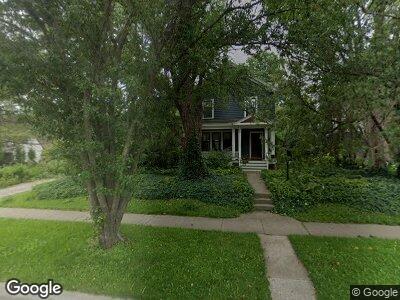
1017 Bowery St Iowa City, IA 52240
Longfellow NeighborhoodEstimated Value: $389,000 - $464,000
3
Beds
1
Bath
1,805
Sq Ft
$228/Sq Ft
Est. Value
About This Home
This home is located at 1017 Bowery St, Iowa City, IA 52240 and is currently estimated at $411,111, approximately $227 per square foot. 1017 Bowery St is a home located in Johnson County with nearby schools including Longfellow Elementary School, Southeast Junior High School, and City High School.
Ownership History
Date
Name
Owned For
Owner Type
Purchase Details
Closed on
May 8, 2019
Sold by
Bradley Jason Troy and Bradley Jason T
Bought by
Bradley Suzanne Celine and Bradley Suzanne C
Current Estimated Value
Home Financials for this Owner
Home Financials are based on the most recent Mortgage that was taken out on this home.
Original Mortgage
$10,000
Interest Rate
4.1%
Mortgage Type
Credit Line Revolving
Purchase Details
Closed on
Jun 28, 2011
Sold by
Montgomery Robert R and Henry Jessie
Bought by
Bradley Jason T and Bradley Suzanne
Home Financials for this Owner
Home Financials are based on the most recent Mortgage that was taken out on this home.
Original Mortgage
$150,000
Interest Rate
4.5%
Mortgage Type
New Conventional
Purchase Details
Closed on
Jul 1, 2005
Sold by
Iowa State Bank & Trust Co
Bought by
Scaglione Martin L and Scaglione Lisa M
Create a Home Valuation Report for This Property
The Home Valuation Report is an in-depth analysis detailing your home's value as well as a comparison with similar homes in the area
Home Values in the Area
Average Home Value in this Area
Purchase History
| Date | Buyer | Sale Price | Title Company |
|---|---|---|---|
| Bradley Suzanne Celine | -- | None Available | |
| Bradley Jason T | $260,000 | None Available | |
| Scaglione Martin L | $413,000 | None Available |
Source: Public Records
Mortgage History
| Date | Status | Borrower | Loan Amount |
|---|---|---|---|
| Open | Bradley Suzanne Celine | $80,000 | |
| Closed | Bradley Suzanne Celine | $80,000 | |
| Closed | Bradley Suzanne | $10,000 | |
| Open | Bradley Suzanne | $193,375 | |
| Closed | Bradley Jason T | $58,000 | |
| Closed | Bradley Jason T | $150,000 |
Source: Public Records
Tax History Compared to Growth
Tax History
| Year | Tax Paid | Tax Assessment Tax Assessment Total Assessment is a certain percentage of the fair market value that is determined by local assessors to be the total taxable value of land and additions on the property. | Land | Improvement |
|---|---|---|---|---|
| 2024 | $7,088 | $387,250 | $81,810 | $305,440 |
| 2023 | $6,606 | $387,250 | $81,810 | $305,440 |
| 2022 | $6,310 | $313,670 | $76,530 | $237,140 |
| 2021 | $6,394 | $313,670 | $76,530 | $237,140 |
| 2020 | $6,394 | $304,310 | $73,890 | $230,420 |
| 2019 | $5,960 | $304,310 | $73,890 | $230,420 |
| 2018 | $5,960 | $279,770 | $68,610 | $211,160 |
| 2017 | $5,750 | $279,770 | $68,610 | $211,160 |
| 2016 | $5,634 | $270,070 | $63,340 | $206,730 |
| 2015 | $5,634 | $270,070 | $63,340 | $206,730 |
| 2014 | $5,388 | $257,770 | $63,340 | $194,430 |
Source: Public Records
Map
Nearby Homes
- 620 S Summit St
- 720 Clark St
- 505 Clark St
- 725 S Summit St
- 447 S Summit St
- 1111 E Court St
- 661 S Governor St
- 841 S Summit St
- 730 S Lucas St
- 821 Longfellow Place
- 835 Longfellow Ct
- 520 S Dodge St
- 826 Page St
- 905 E Burlington St
- 1004 Kirkwood Ave
- 903 E Burlington St
- 820 Kirkwood Ave
- 226 S Lucas St
- 711 E Burlington St
- 1531 Center Ave
- 1017 Bowery St
- 1029 Bowery St
- 612 S Summit St Unit 1102 Saint Clements
- 602 S Summit St
- 625 Clark St
- 705 Clark St
- 1024 Bowery St
- 540 S Summit St
- 624 S Summit St
- 1030 Bowery St
- 709 Clark St
- 536 S Summit St
- 610 Clark St
- 531 Clark St
- 614 Clark St
- 715 Clark St
- 710 S Summit St
- 530 S Summit St
- 602 Clark St
- 527 Clark St