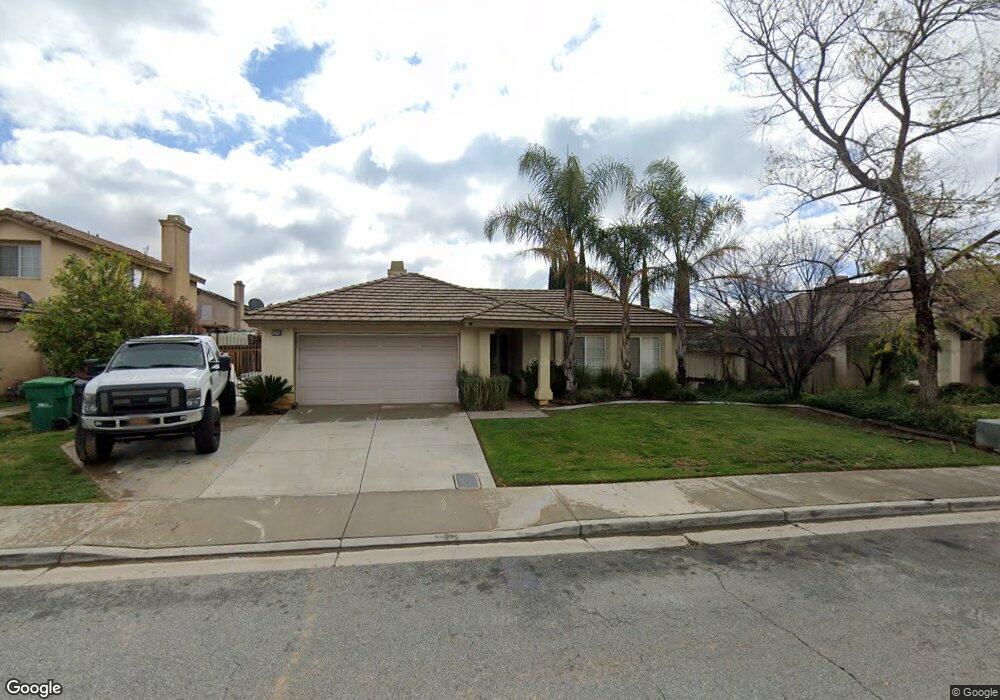
1018 Darby Dan Way Beaumont, CA 92223
Estimated Value: $473,000 - $512,000
3
Beds
2
Baths
1,400
Sq Ft
$354/Sq Ft
Est. Value
About This Home
This home is located at 1018 Darby Dan Way, Beaumont, CA 92223 and is currently estimated at $495,196, approximately $353 per square foot. 1018 Darby Dan Way is a home located in Riverside County with nearby schools including Three Rings Ranch Elementary School, Mountain View Middle School, and Beaumont Senior High School.
Ownership History
Date
Name
Owned For
Owner Type
Purchase Details
Closed on
Apr 19, 2013
Sold by
Oltman Tom and Oltman Jody
Bought by
Oltman Tom and Oltman Jody
Current Estimated Value
Purchase Details
Closed on
Jan 25, 2006
Sold by
Mendoza Mary
Bought by
Oltman Tom C and Mcdonnell Jody
Home Financials for this Owner
Home Financials are based on the most recent Mortgage that was taken out on this home.
Original Mortgage
$267,200
Outstanding Balance
$149,709
Interest Rate
6.12%
Mortgage Type
Purchase Money Mortgage
Estimated Equity
$345,487
Purchase Details
Closed on
Nov 10, 2004
Sold by
Meier Chad and Meier Julie
Bought by
Mendoza Mary
Home Financials for this Owner
Home Financials are based on the most recent Mortgage that was taken out on this home.
Original Mortgage
$215,000
Interest Rate
5.7%
Mortgage Type
Purchase Money Mortgage
Purchase Details
Closed on
Jan 11, 2002
Sold by
Osborne Development Corp
Bought by
Meier Chad and Meier Julie
Home Financials for this Owner
Home Financials are based on the most recent Mortgage that was taken out on this home.
Original Mortgage
$149,394
Interest Rate
6.87%
Mortgage Type
FHA
Create a Home Valuation Report for This Property
The Home Valuation Report is an in-depth analysis detailing your home's value as well as a comparison with similar homes in the area
Home Values in the Area
Average Home Value in this Area
Purchase History
| Date | Buyer | Sale Price | Title Company |
|---|---|---|---|
| Oltman Tom | -- | None Available | |
| Oltman Tom C | $334,000 | Old Republic Title | |
| Mendoza Mary | $305,000 | United Title Company | |
| Meier Chad | $152,000 | Fidelity National Title Co |
Source: Public Records
Mortgage History
| Date | Status | Borrower | Loan Amount |
|---|---|---|---|
| Open | Oltman Tom C | $267,200 | |
| Previous Owner | Mendoza Mary | $215,000 | |
| Previous Owner | Meier Chad | $149,394 |
Source: Public Records
Tax History Compared to Growth
Tax History
| Year | Tax Paid | Tax Assessment Tax Assessment Total Assessment is a certain percentage of the fair market value that is determined by local assessors to be the total taxable value of land and additions on the property. | Land | Improvement |
|---|---|---|---|---|
| 2025 | $6,755 | $456,410 | $129,810 | $326,600 |
| 2023 | $6,755 | $438,689 | $124,770 | $313,919 |
| 2022 | $6,458 | $417,631 | $118,919 | $298,712 |
| 2021 | $5,614 | $353,924 | $100,778 | $253,146 |
| 2020 | $5,101 | $316,004 | $89,981 | $226,023 |
| 2019 | $4,972 | $306,800 | $87,360 | $219,440 |
| 2018 | $5,014 | $295,000 | $84,000 | $211,000 |
| 2017 | $4,886 | $276,000 | $79,000 | $197,000 |
| 2016 | $4,507 | $247,000 | $70,000 | $177,000 |
| 2015 | $4,293 | $233,000 | $66,000 | $167,000 |
| 2014 | $3,489 | $166,000 | $47,000 | $119,000 |
Source: Public Records
Map
Nearby Homes
- 707 Brookside Ln
- 1151 Sagamore Cir
- 729 Windbound Ave
- 0 Orchard Unit SR23195193
- 0 Vineland Unit IG25108626
- 0 No Address Unit CV25199605
- 0 No Address Unit CV25199592
- 0 No Address Unit CV25199560
- 0 Union Vineland Unit EV24050578
- 0 Oak Glen Rd Unit CV25224046
- 1211 Olive Ave
- 801 Elm Ave
- 1127 Edgar Ave
- 1032 Western Knolls Ave
- 0 Edgar Ave Unit HD24231259
- 1292 N California Ave
- 721 Aspen Glen Ln
- 737 Edgar Ave
- 322 E 11th St
- 559 Edgar Ave Unit A2-282
- 1012 Darby Dan Way
- 1022 Darby Dan Way
- 955 Wilmont Way
- 943 Wilmont Way
- 1030 Darby Dan Way
- 1021 Willmont Way
- 1021 Wilmont Way
- 1008 Darby Dan Way
- 931 Willmont Way
- 931 Wilmont Way
- 1019 Darby Dan Way
- 1013 Darby Dan Way
- 1023 Darby Dan Way
- 1033 Wilmont Way
- 921 Wilmont Way
- 1046 Darby Dan Way
- 1009 Darby Dan Way
- 1031 Darby Dan Way
- 1002 Darby Dan Way
- 1045 Wilmont Way