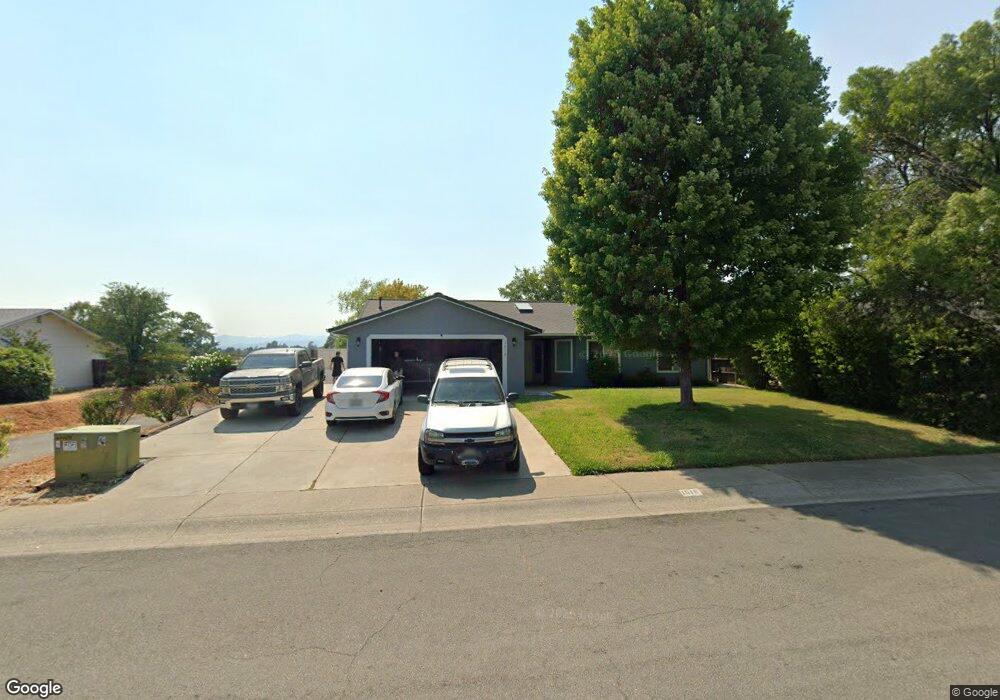
1018 Lema Rd Redding, CA 96003
Lema Ranch NeighborhoodEstimated Value: $348,000 - $398,000
3
Beds
2
Baths
1,526
Sq Ft
$245/Sq Ft
Est. Value
About This Home
This home is located at 1018 Lema Rd, Redding, CA 96003 and is currently estimated at $374,339, approximately $245 per square foot. 1018 Lema Rd is a home located in Shasta County with nearby schools including Columbia Elementary School, Mountain View Middle School, and Foothill High School.
Ownership History
Date
Name
Owned For
Owner Type
Purchase Details
Closed on
Oct 8, 2012
Sold by
Nickell Amber R
Bought by
Nickell Amber
Current Estimated Value
Purchase Details
Closed on
Sep 21, 2010
Sold by
Nickell Amber R
Bought by
Nickell Amber R
Home Financials for this Owner
Home Financials are based on the most recent Mortgage that was taken out on this home.
Original Mortgage
$151,000
Outstanding Balance
$99,253
Interest Rate
4.35%
Mortgage Type
New Conventional
Estimated Equity
$275,086
Purchase Details
Closed on
Nov 14, 2001
Sold by
Nickell Robert J and Nickell Amber R
Bought by
Nickell Robert J and Nickell Amber R
Home Financials for this Owner
Home Financials are based on the most recent Mortgage that was taken out on this home.
Original Mortgage
$27,000
Interest Rate
6.62%
Mortgage Type
Credit Line Revolving
Purchase Details
Closed on
Apr 27, 1998
Sold by
Hud
Bought by
Nickell Robert J and Pennington Amber
Home Financials for this Owner
Home Financials are based on the most recent Mortgage that was taken out on this home.
Original Mortgage
$93,610
Interest Rate
7.06%
Mortgage Type
FHA
Purchase Details
Closed on
Nov 10, 1997
Sold by
Norwest Mtg Inc
Bought by
Hud
Create a Home Valuation Report for This Property
The Home Valuation Report is an in-depth analysis detailing your home's value as well as a comparison with similar homes in the area
Home Values in the Area
Average Home Value in this Area
Purchase History
| Date | Buyer | Sale Price | Title Company |
|---|---|---|---|
| Nickell Amber | -- | None Available | |
| Nickell Amber R | -- | Multiple | |
| Nickell Robert J | -- | Alliance Title Company | |
| Nickell Robert J | -- | Placer Title Company | |
| Hud | -- | Fidelity National Title | |
| Norwest Mtg Inc | $122,838 | Fidelity National Title Ins |
Source: Public Records
Mortgage History
| Date | Status | Borrower | Loan Amount |
|---|---|---|---|
| Open | Nickell Amber R | $151,000 | |
| Closed | Nickell Robert J | $27,000 | |
| Closed | Nickell Robert J | $93,610 |
Source: Public Records
Tax History
| Year | Tax Paid | Tax Assessment Tax Assessment Total Assessment is a certain percentage of the fair market value that is determined by local assessors to be the total taxable value of land and additions on the property. | Land | Improvement |
|---|---|---|---|---|
| 2025 | $1,882 | $187,259 | $41,503 | $145,756 |
| 2024 | $1,890 | $183,589 | $40,690 | $142,899 |
| 2023 | $1,890 | $179,991 | $39,893 | $140,098 |
| 2022 | $1,826 | $176,462 | $39,111 | $137,351 |
| 2021 | $1,811 | $173,003 | $38,345 | $134,658 |
| 2020 | $1,796 | $171,230 | $37,952 | $133,278 |
| 2019 | $1,754 | $167,873 | $37,208 | $130,665 |
| 2018 | $1,766 | $164,582 | $36,479 | $128,103 |
| 2017 | $1,787 | $161,356 | $35,764 | $125,592 |
| 2016 | $1,669 | $158,193 | $35,063 | $123,130 |
| 2015 | $1,642 | $155,818 | $34,537 | $121,281 |
| 2014 | $1,599 | $152,767 | $33,861 | $118,906 |
Source: Public Records
Map
Nearby Homes
- 965 Willow Brook Ln
- 1090 Gibralter Rd
- 1110 Grouse Dr
- 1637 French Lace Ln
- 2182 Cadjew St
- 550 Armando Ave
- 1285 Lancers Ln
- 1088 Burton Dr
- 547 Casa Buena St
- 1230 Whistling Dr
- 1939 Cameo Ct
- 10033 Abernathy Ln
- 2093 Victor Ave
- 667 Reddington Dr
- 2385 Shining Star Way
- 332 Franciscan Trail
- 2199 Princeton Way
- 790 Volcano View Trail
- 006 Old Oregon Trail
- 771 Flower Ash Ln
- 1006 Lema Rd
- 1046 Lema Rd
- 1022 Lema Rd
- 1052 Lema Rd
- 1034 Lema Rd
- 1064 Lema Rd
- 1025 Nighthawk Ln
- 1076 Lema Rd
- 1037 Nighthawk Ln
- 2135 Tiburon Dr
- 1049 Nighthawk Ln
- 1013 Nighthawk Ln
- 1088 Lema Rd
- 1053 Nighthawk Ln
- 2123 Tiburon Dr
- 1067 Nighthawk Ln
- 2117 Tiburon Dr
- 2190 Osprey Ln
- 2172 Osprey Ln
- 2154 Osprey Ln
Your Personal Tour Guide
Ask me questions while you tour the home.