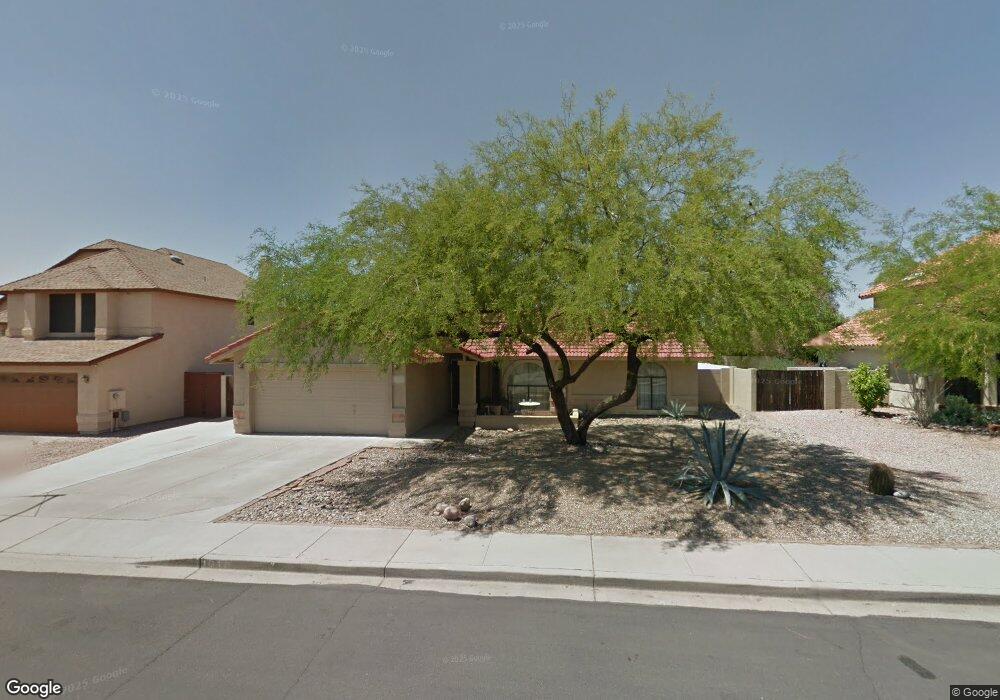
1018 N 59th St Mesa, AZ 85205
Central Mesa East NeighborhoodEstimated Value: $419,186 - $502,000
Studio
2
Baths
1,708
Sq Ft
$272/Sq Ft
Est. Value
About This Home
This home is located at 1018 N 59th St, Mesa, AZ 85205 and is currently estimated at $464,047, approximately $271 per square foot. 1018 N 59th St is a home located in Maricopa County with nearby schools including Mendoza Elementary School, Franklin at Brimhall Elementary School, and Franklin West Elementary School.
Ownership History
Date
Name
Owned For
Owner Type
Purchase Details
Closed on
Dec 11, 2007
Sold by
Atchison Terry L
Bought by
Atchison Terry L
Current Estimated Value
Home Financials for this Owner
Home Financials are based on the most recent Mortgage that was taken out on this home.
Original Mortgage
$242,250
Outstanding Balance
$152,619
Interest Rate
6.21%
Mortgage Type
New Conventional
Estimated Equity
$311,428
Purchase Details
Closed on
Oct 8, 2002
Sold by
Gumz Karen R
Bought by
Atchison Terry L
Purchase Details
Closed on
Oct 4, 2002
Sold by
Hix Carter A
Bought by
Atchison Terry L
Purchase Details
Closed on
Mar 7, 1994
Sold by
Stack Paul D
Bought by
Gumz John F and Gumz Karen R
Home Financials for this Owner
Home Financials are based on the most recent Mortgage that was taken out on this home.
Original Mortgage
$61,495
Interest Rate
7.67%
Mortgage Type
New Conventional
Create a Home Valuation Report for This Property
The Home Valuation Report is an in-depth analysis detailing your home's value as well as a comparison with similar homes in the area
Home Values in the Area
Average Home Value in this Area
Purchase History
| Date | Buyer | Sale Price | Title Company |
|---|---|---|---|
| Atchison Terry L | -- | Title Source Inc | |
| Atchison Terry L | $164,000 | Fidelity National Title | |
| Atchison Terry L | -- | Fidelity National Title | |
| Gumz John F | $125,500 | Security Title Agency |
Source: Public Records
Mortgage History
| Date | Status | Borrower | Loan Amount |
|---|---|---|---|
| Open | Atchison Terry L | $242,250 | |
| Previous Owner | Gumz John F | $61,495 |
Source: Public Records
Tax History
| Year | Tax Paid | Tax Assessment Tax Assessment Total Assessment is a certain percentage of the fair market value that is determined by local assessors to be the total taxable value of land and additions on the property. | Land | Improvement |
|---|---|---|---|---|
| 2025 | $1,727 | $20,789 | -- | -- |
| 2024 | $1,745 | $19,799 | -- | -- |
| 2023 | $1,745 | $36,110 | $7,220 | $28,890 |
| 2022 | $1,707 | $27,370 | $5,470 | $21,900 |
| 2021 | $1,754 | $24,610 | $4,920 | $19,690 |
| 2020 | $1,730 | $23,030 | $4,600 | $18,430 |
| 2019 | $1,603 | $21,520 | $4,300 | $17,220 |
| 2018 | $1,530 | $19,830 | $3,960 | $15,870 |
| 2017 | $1,482 | $19,080 | $3,810 | $15,270 |
| 2016 | $1,456 | $18,730 | $3,740 | $14,990 |
| 2015 | $1,374 | $17,800 | $3,560 | $14,240 |
Source: Public Records
Map
Nearby Homes
- 5757 E Fox St
- 5829 E Enrose St
- 5651 E Fairfield St
- 5963 E Enrose Cir
- 5853 E Adobe Rd
- 5822 E Duncan St
- 5862 E Duncan St
- 5703 E Greenway St
- 6061 E Evergreen St
- 6051 E Ensenada St
- 5903 E Duncan St
- 5915 E Duncan St
- 5552 E Enrose St
- 5851 E Dodge St
- 5704 E Dodge St
- 5857 E Dodge St
- 6134 E Ensenada St
- 1340 N Recker Rd Unit 109
- 1340 N Recker Rd Unit 343
- 1340 N Recker Rd Unit 209
- 1026 N 59th St
- 1010 N 59th St
- 1011 N Sunview Cir
- 1003 N Sunview Cir
- 1032 N 59th St
- 1017 N 59th St Unit 5C
- 5835 E Fairfield St
- 1025 N 59th St
- 1009 N 59th St Unit 5C
- 961 N Sunview Cir
- 1018 N Sunview Cir
- 1033 N 59th St
- 5827 E Fairfield St
- 962 N 59th St
- 5904 E Encanto St
- 5819 E Fairfield St
- 960 N Sunview Cir
- 5842 E Fairfield St
- 5850 E Fairfield St Unit 5A
- 1010 N Sunview Cir
Your Personal Tour Guide
Ask me questions while you tour the home.