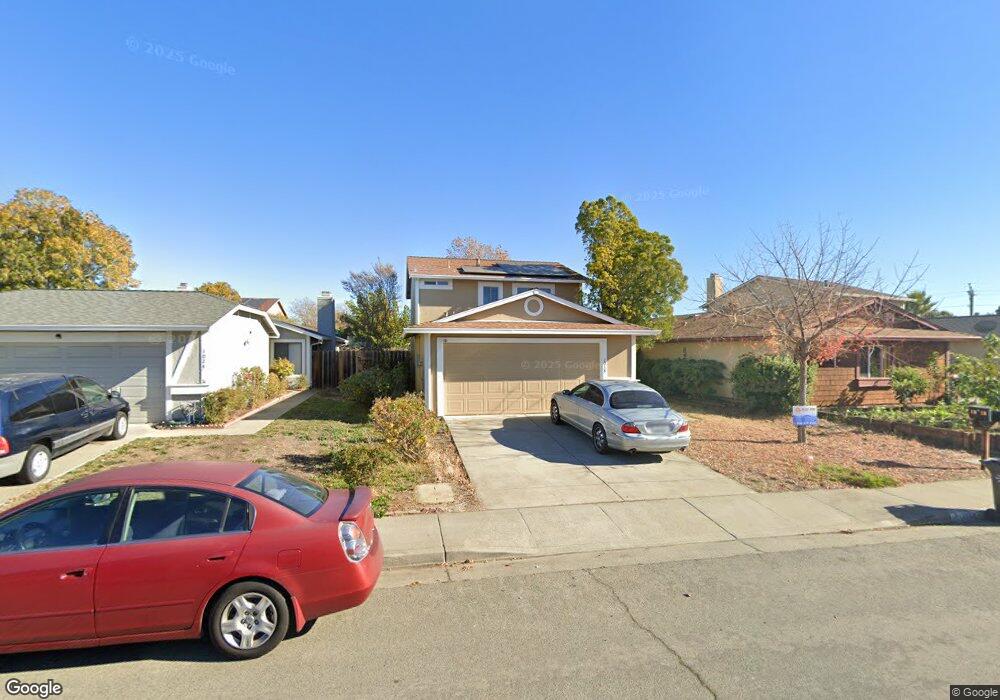
1018 Scott St Fairfield, CA 94533
Estimated Value: $496,064 - $541,000
4
Beds
3
Baths
1,560
Sq Ft
$336/Sq Ft
Est. Value
About This Home
This home is located at 1018 Scott St, Fairfield, CA 94533 and is currently estimated at $523,516, approximately $335 per square foot. 1018 Scott St is a home located in Solano County with nearby schools including Cleo Gordon Elementary School, Grange Middle School, and Fairfield High School.
Ownership History
Date
Name
Owned For
Owner Type
Purchase Details
Closed on
Jul 20, 2022
Sold by
Janet Ellenberg
Bought by
Janet Ellenberg Revocable Trust
Current Estimated Value
Purchase Details
Closed on
Jul 26, 2002
Sold by
Ellenberg Janet
Bought by
Ellenberg Janet
Home Financials for this Owner
Home Financials are based on the most recent Mortgage that was taken out on this home.
Original Mortgage
$184,000
Interest Rate
6.6%
Create a Home Valuation Report for This Property
The Home Valuation Report is an in-depth analysis detailing your home's value as well as a comparison with similar homes in the area
Home Values in the Area
Average Home Value in this Area
Purchase History
| Date | Buyer | Sale Price | Title Company |
|---|---|---|---|
| Janet Ellenberg Revocable Trust | -- | -- | |
| Ellenberg Janet | -- | North American Title Co |
Source: Public Records
Mortgage History
| Date | Status | Borrower | Loan Amount |
|---|---|---|---|
| Previous Owner | Ellenberg Janet | $184,000 |
Source: Public Records
Tax History
| Year | Tax Paid | Tax Assessment Tax Assessment Total Assessment is a certain percentage of the fair market value that is determined by local assessors to be the total taxable value of land and additions on the property. | Land | Improvement |
|---|---|---|---|---|
| 2025 | $2,188 | $201,324 | $49,780 | $151,544 |
| 2024 | $2,188 | $197,377 | $48,804 | $148,573 |
| 2023 | $3,069 | $193,508 | $47,848 | $145,660 |
| 2022 | $3,042 | $189,714 | $46,910 | $142,804 |
| 2021 | $2,970 | $185,995 | $45,991 | $140,004 |
| 2020 | $2,022 | $184,089 | $45,520 | $138,569 |
| 2019 | $1,971 | $180,480 | $44,628 | $135,852 |
| 2018 | $2,033 | $176,942 | $43,753 | $133,189 |
| 2017 | $1,938 | $173,474 | $42,896 | $130,578 |
| 2016 | $1,916 | $170,073 | $42,055 | $128,018 |
| 2015 | $1,788 | $167,520 | $41,424 | $126,096 |
| 2014 | $1,770 | $164,239 | $40,613 | $123,626 |
Source: Public Records
Map
Nearby Homes
- 1695 Blossom Ave
- 1941 Grande Cir Unit 45
- 1941 Grande Cir Unit 48
- 350 Jacaranda Dr
- 356 Jacaranda Dr
- 523 Thomas Cir
- 421 Sarah Way
- 1926 Blossom Ct
- 1045 Camellia Ct
- 1857 San Pedro Ct
- 849 Finch Way
- 725 San Pedro St
- 1624 Dover Ave
- 2013 Cormorant Dr
- 1206 Ricky Ct
- 1210 Humphrey Dr
- 117 Summertime Ln
- 826 Scaup Ln
- 1424 Mckinley St
- 615 Chyrl Way
Your Personal Tour Guide
Ask me questions while you tour the home.