Estimated Value: $492,000 - $533,000
2
Beds
2
Baths
1,382
Sq Ft
$378/Sq Ft
Est. Value
About This Home
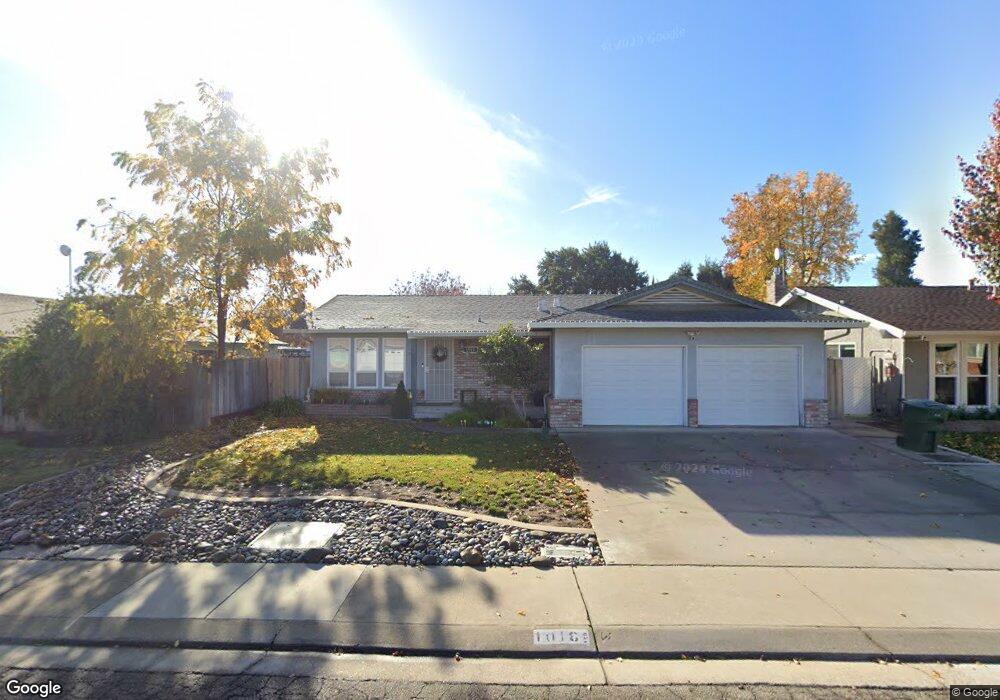
This home is located at 1018 Stuart St, Ripon, CA 95366 and is currently estimated at $522,246, approximately $377 per square foot. 1018 Stuart St is a home located in San Joaquin County with nearby schools including Weston Elementary School, Ripon Elementary School, and Park View Elementary School.
Ownership History
Date
Name
Owned For
Owner Type
Purchase Details
Closed on
Jan 17, 2020
Sold by
Weide Thomas David Vander and The Vander Weide Family Trust
Bought by
Fredriks Emily A
Current Estimated Value
Home Financials for this Owner
Home Financials are based on the most recent Mortgage that was taken out on this home.
Original Mortgage
$289,800
Outstanding Balance
$256,689
Interest Rate
3.73%
Mortgage Type
New Conventional
Estimated Equity
$265,557
Purchase Details
Closed on
Jun 28, 2005
Sold by
Vander Weide Raymond and Vander Weide Marilyn
Bought by
Vander Weide Raymond and Vander Weide Marilyn J
Purchase Details
Closed on
Aug 18, 1997
Sold by
Vanvuren I
Bought by
Vanderweide Raymond and Vanderweide Marilyn
Home Financials for this Owner
Home Financials are based on the most recent Mortgage that was taken out on this home.
Original Mortgage
$100,000
Interest Rate
7.45%
Mortgage Type
Seller Take Back
Create a Home Valuation Report for This Property
The Home Valuation Report is an in-depth analysis detailing your home's value as well as a comparison with similar homes in the area
Home Values in the Area
Average Home Value in this Area
Purchase History
| Date | Buyer | Sale Price | Title Company |
|---|---|---|---|
| Fredriks Emily A | $322,000 | Fidelity National Title Co | |
| Vander Weide Raymond | -- | -- | |
| Vanderweide Raymond | $120,000 | Chicago Title Co |
Source: Public Records
Mortgage History
| Date | Status | Borrower | Loan Amount |
|---|---|---|---|
| Open | Fredriks Emily A | $289,800 | |
| Previous Owner | Vanderweide Raymond | $100,000 |
Source: Public Records
Tax History
| Year | Tax Paid | Tax Assessment Tax Assessment Total Assessment is a certain percentage of the fair market value that is determined by local assessors to be the total taxable value of land and additions on the property. | Land | Improvement |
|---|---|---|---|---|
| 2025 | $4,245 | $396,989 | $98,426 | $298,563 |
| 2024 | $4,173 | $389,206 | $96,497 | $292,709 |
| 2023 | $4,087 | $381,575 | $94,605 | $286,970 |
| 2022 | $4,020 | $374,094 | $92,750 | $281,344 |
| 2021 | $3,957 | $366,760 | $90,932 | $275,828 |
| 2020 | $1,917 | $175,193 | $72,997 | $102,196 |
| 2019 | $1,883 | $171,759 | $71,566 | $100,193 |
| 2018 | $1,854 | $168,392 | $70,163 | $98,229 |
| 2017 | $1,817 | $165,091 | $68,788 | $96,303 |
| 2016 | $1,787 | $161,855 | $67,440 | $94,415 |
| 2014 | $1,719 | $156,302 | $65,126 | $91,176 |
Source: Public Records
Map
Nearby Homes
- 916 6th St
- 23811 S Jack Tone Rd
- 138 Roxie Ct
- 1601 Stanley Dr
- 924 Kingery Dr
- 1621 Davis St
- 1691 Davis St
- 1315 Augusta Pointe Dr
- 1122 Zumstein Ct
- 336 Kristen Way
- 1080 Ruess Rd
- 1672 Bailey Dr
- 1434 Augusta Pointe Dr
- 150 N Acacia Ave
- 602 S Highland Ave
- 205 3rd St
- 410 Pine St
- 637 Rebekah Ct
- 663 Clay Way
- 1191 S Mohler Rd
Your Personal Tour Guide
Ask me questions while you tour the home.