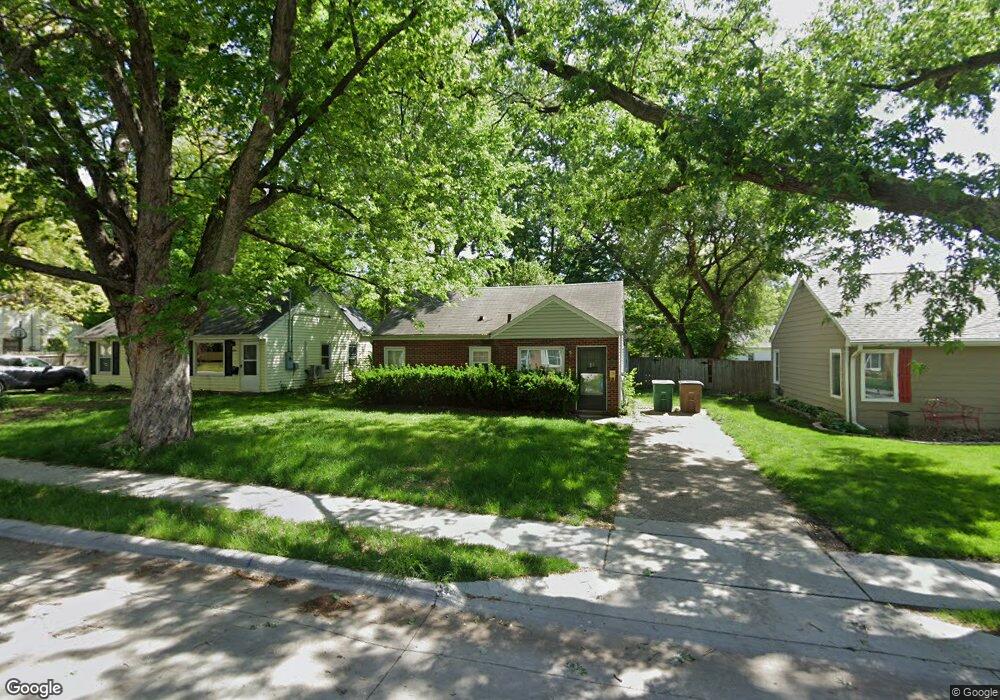
1019 69th St Windsor Heights, IA 50324
Estimated Value: $172,000 - $195,607
3
Beds
1
Bath
900
Sq Ft
$206/Sq Ft
Est. Value
About This Home
This home is located at 1019 69th St, Windsor Heights, IA 50324 and is currently estimated at $185,402, approximately $206 per square foot. 1019 69th St is a home located in Polk County with nearby schools including Windsor Elementary School, Merrill Middle School, and Roosevelt High School.
Ownership History
Date
Name
Owned For
Owner Type
Purchase Details
Closed on
Jun 10, 2013
Sold by
Lukacs Aaron and Lukacs Sherri
Bought by
Stockbauer Joshua M
Current Estimated Value
Home Financials for this Owner
Home Financials are based on the most recent Mortgage that was taken out on this home.
Original Mortgage
$87,387
Outstanding Balance
$62,668
Interest Rate
3.75%
Mortgage Type
FHA
Estimated Equity
$122,734
Purchase Details
Closed on
May 6, 1999
Sold by
Renda Thomas F and Renda Nancy S
Bought by
Lukacs Aaron and Lukacs Sherri
Home Financials for this Owner
Home Financials are based on the most recent Mortgage that was taken out on this home.
Original Mortgage
$55,250
Interest Rate
7.04%
Purchase Details
Closed on
Feb 23, 1999
Sold by
Lynch James A and Lynch Helen P
Bought by
Renda Thomas F and Renda Nancy S
Home Financials for this Owner
Home Financials are based on the most recent Mortgage that was taken out on this home.
Original Mortgage
$52,000
Interest Rate
6.92%
Create a Home Valuation Report for This Property
The Home Valuation Report is an in-depth analysis detailing your home's value as well as a comparison with similar homes in the area
Home Values in the Area
Average Home Value in this Area
Purchase History
| Date | Buyer | Sale Price | Title Company |
|---|---|---|---|
| Stockbauer Joshua M | $89,000 | None Available | |
| Lukacs Aaron | $64,500 | -- | |
| Renda Thomas F | $48,500 | -- |
Source: Public Records
Mortgage History
| Date | Status | Borrower | Loan Amount |
|---|---|---|---|
| Open | Stockbauer Joshua M | $87,387 | |
| Previous Owner | Lukacs Aaron | $55,250 | |
| Previous Owner | Renda Thomas F | $52,000 |
Source: Public Records
Tax History Compared to Growth
Tax History
| Year | Tax Paid | Tax Assessment Tax Assessment Total Assessment is a certain percentage of the fair market value that is determined by local assessors to be the total taxable value of land and additions on the property. | Land | Improvement |
|---|---|---|---|---|
| 2025 | $2,698 | $160,400 | $44,000 | $116,400 |
| 2024 | $2,698 | $143,800 | $38,900 | $104,900 |
| 2023 | $2,628 | $143,800 | $38,900 | $104,900 |
| 2022 | $2,608 | $118,300 | $32,500 | $85,800 |
| 2021 | $2,568 | $118,300 | $32,500 | $85,800 |
| 2020 | $2,676 | $107,200 | $29,300 | $77,900 |
| 2019 | $2,700 | $107,200 | $29,300 | $77,900 |
| 2018 | $2,642 | $99,800 | $26,900 | $72,900 |
| 2017 | $2,520 | $99,800 | $26,900 | $72,900 |
| 2016 | $2,390 | $92,300 | $24,500 | $67,800 |
| 2015 | $2,390 | $92,300 | $24,500 | $67,800 |
| 2014 | $2,300 | $91,800 | $23,900 | $67,900 |
Source: Public Records
Map
Nearby Homes
- 1008 67th St
- 6750 School St Unit 206
- 6750 School St Unit 205
- 1206 68th St
- 1303 68th St
- 1233 72nd St
- 1129 64th St
- 6423 Carpenter Ave
- 6521 Elmcrest Dr
- 3927 Westgate Pkwy
- 4052 NW 175th St
- 3945 Westgate Pkwy
- 3963 Westgate Pkwy
- 6826 Colby Ave
- 6420 Center St
- 1236 63rd St
- 6564 Colby Ave
- 6330 Center St
- 720 63rd St
- 5912 Rutland Dr